Immigrants from Hong Kong vs Immigrants from Sudan In Labor Force | Age > 16
COMPARE
Immigrants from Hong Kong
Immigrants from Sudan
In Labor Force | Age > 16
In Labor Force | Age > 16 Comparison
Immigrants from Hong Kong
Immigrants from Sudan
65.7%
IN LABOR FORCE | AGE > 16
96.2/ 100
METRIC RATING
120th/ 347
METRIC RANK
67.7%
IN LABOR FORCE | AGE > 16
100.0/ 100
METRIC RATING
16th/ 347
METRIC RANK
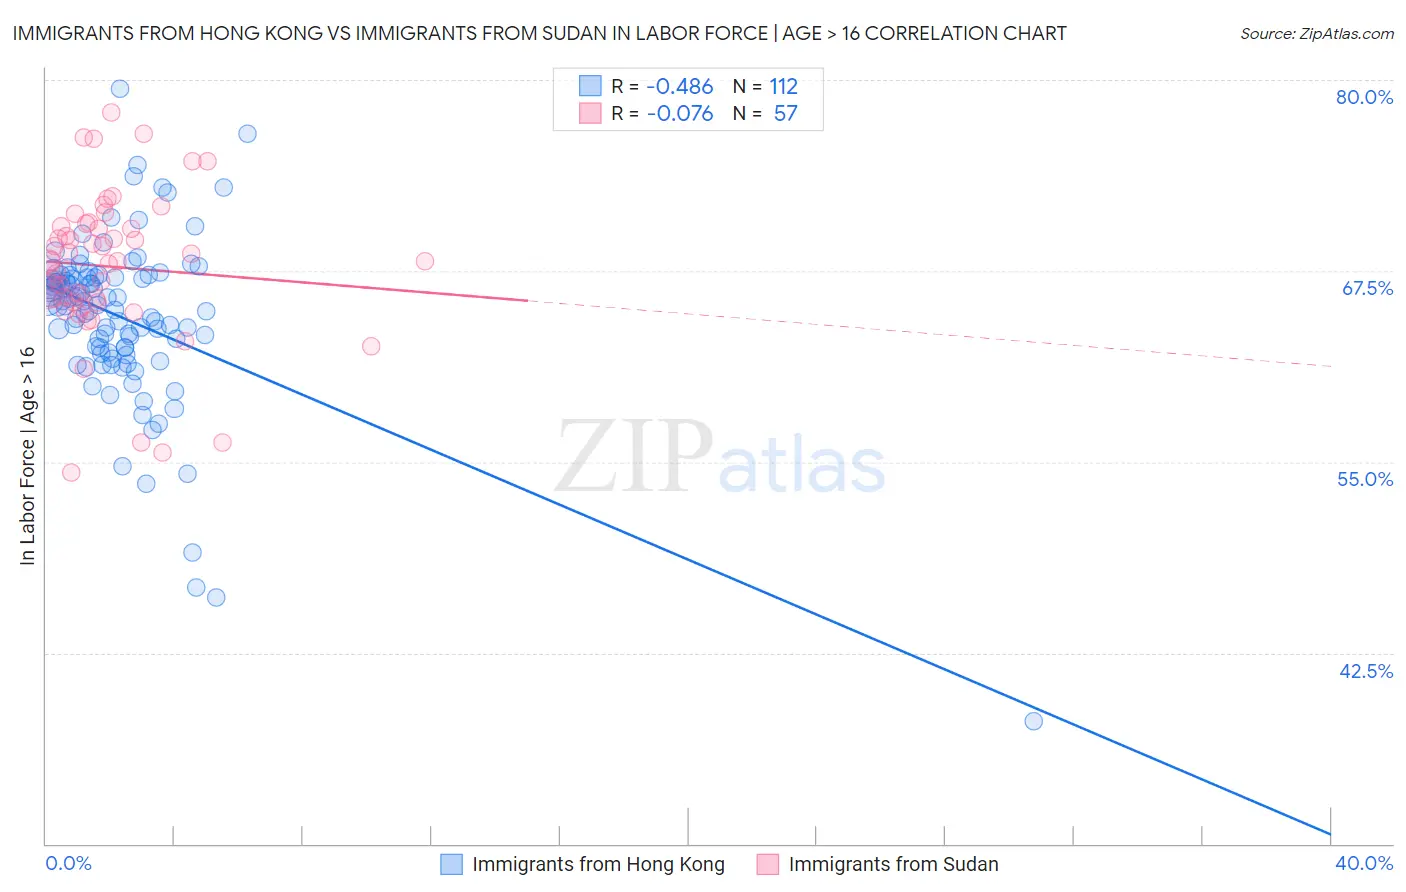
Immigrants from Hong Kong vs Immigrants from Sudan In Labor Force | Age > 16 Correlation Chart
The statistical analysis conducted on geographies consisting of 254,003,180 people shows a moderate negative correlation between the proportion of Immigrants from Hong Kong and labor force participation rate among population ages 16 and over in the United States with a correlation coefficient (R) of -0.486 and weighted average of 65.7%. Similarly, the statistical analysis conducted on geographies consisting of 118,970,540 people shows a slight negative correlation between the proportion of Immigrants from Sudan and labor force participation rate among population ages 16 and over in the United States with a correlation coefficient (R) of -0.076 and weighted average of 67.7%, a difference of 3.0%.
In Labor Force | Age > 16 Correlation Summary
| Measurement | Immigrants from Hong Kong | Immigrants from Sudan |
| Minimum | 38.0% | 54.3% |
| Maximum | 79.4% | 77.9% |
| Range | 41.4% | 23.6% |
| Mean | 64.4% | 67.8% |
| Median | 65.4% | 68.1% |
| Interquartile 25% (IQ1) | 62.3% | 65.4% |
| Interquartile 75% (IQ3) | 67.1% | 70.5% |
| Interquartile Range (IQR) | 4.8% | 5.1% |
| Standard Deviation (Sample) | 5.7% | 4.9% |
| Standard Deviation (Population) | 5.6% | 4.9% |
Similar Demographics by In Labor Force | Age > 16
Demographics Similar to Immigrants from Hong Kong by In Labor Force | Age > 16
In terms of in labor force | age > 16, the demographic groups most similar to Immigrants from Hong Kong are Immigrants from France (65.7%, a difference of 0.020%), New Zealander (65.7%, a difference of 0.020%), Immigrants from Ecuador (65.7%, a difference of 0.020%), Immigrants from Iran (65.7%, a difference of 0.030%), and Immigrants from Thailand (65.7%, a difference of 0.030%).
| Demographics | Rating | Rank | In Labor Force | Age > 16 |
| Pakistanis | 97.1 /100 | #113 | Exceptional 65.8% |
| Hondurans | 97.1 /100 | #114 | Exceptional 65.8% |
| Immigrants | Indonesia | 96.8 /100 | #115 | Exceptional 65.7% |
| Argentineans | 96.7 /100 | #116 | Exceptional 65.7% |
| Immigrants | Iran | 96.6 /100 | #117 | Exceptional 65.7% |
| Immigrants | Thailand | 96.6 /100 | #118 | Exceptional 65.7% |
| Immigrants | France | 96.4 /100 | #119 | Exceptional 65.7% |
| Immigrants | Hong Kong | 96.2 /100 | #120 | Exceptional 65.7% |
| New Zealanders | 96.0 /100 | #121 | Exceptional 65.7% |
| Immigrants | Ecuador | 95.9 /100 | #122 | Exceptional 65.7% |
| Immigrants | Iraq | 95.5 /100 | #123 | Exceptional 65.7% |
| Iraqis | 95.4 /100 | #124 | Exceptional 65.7% |
| Norwegians | 95.3 /100 | #125 | Exceptional 65.7% |
| Koreans | 95.3 /100 | #126 | Exceptional 65.7% |
| Immigrants | Eastern Asia | 94.9 /100 | #127 | Exceptional 65.7% |
Demographics Similar to Immigrants from Sudan by In Labor Force | Age > 16
In terms of in labor force | age > 16, the demographic groups most similar to Immigrants from Sudan are Immigrants from India (67.6%, a difference of 0.070%), Immigrants from Liberia (67.6%, a difference of 0.090%), Immigrants from Middle Africa (67.7%, a difference of 0.11%), Kenyan (67.6%, a difference of 0.13%), and Liberian (67.8%, a difference of 0.16%).
| Demographics | Rating | Rank | In Labor Force | Age > 16 |
| Immigrants | Eastern Africa | 100.0 /100 | #9 | Exceptional 68.5% |
| Immigrants | Bolivia | 100.0 /100 | #10 | Exceptional 68.4% |
| Bolivians | 100.0 /100 | #11 | Exceptional 68.2% |
| Sudanese | 100.0 /100 | #12 | Exceptional 68.0% |
| Immigrants | Nepal | 100.0 /100 | #13 | Exceptional 68.0% |
| Liberians | 100.0 /100 | #14 | Exceptional 67.8% |
| Immigrants | Middle Africa | 100.0 /100 | #15 | Exceptional 67.7% |
| Immigrants | Sudan | 100.0 /100 | #16 | Exceptional 67.7% |
| Immigrants | India | 100.0 /100 | #17 | Exceptional 67.6% |
| Immigrants | Liberia | 100.0 /100 | #18 | Exceptional 67.6% |
| Kenyans | 100.0 /100 | #19 | Exceptional 67.6% |
| Immigrants | Kenya | 100.0 /100 | #20 | Exceptional 67.6% |
| Tongans | 100.0 /100 | #21 | Exceptional 67.5% |
| Immigrants | Uganda | 100.0 /100 | #22 | Exceptional 67.5% |
| Cambodians | 100.0 /100 | #23 | Exceptional 67.4% |