Immigrants from Hong Kong vs Cuban In Labor Force | Age > 16
COMPARE
Immigrants from Hong Kong
Cuban
In Labor Force | Age > 16
In Labor Force | Age > 16 Comparison
Immigrants from Hong Kong
Cubans
65.7%
IN LABOR FORCE | AGE > 16
96.2/ 100
METRIC RATING
120th/ 347
METRIC RANK
64.2%
IN LABOR FORCE | AGE > 16
0.5/ 100
METRIC RATING
265th/ 347
METRIC RANK
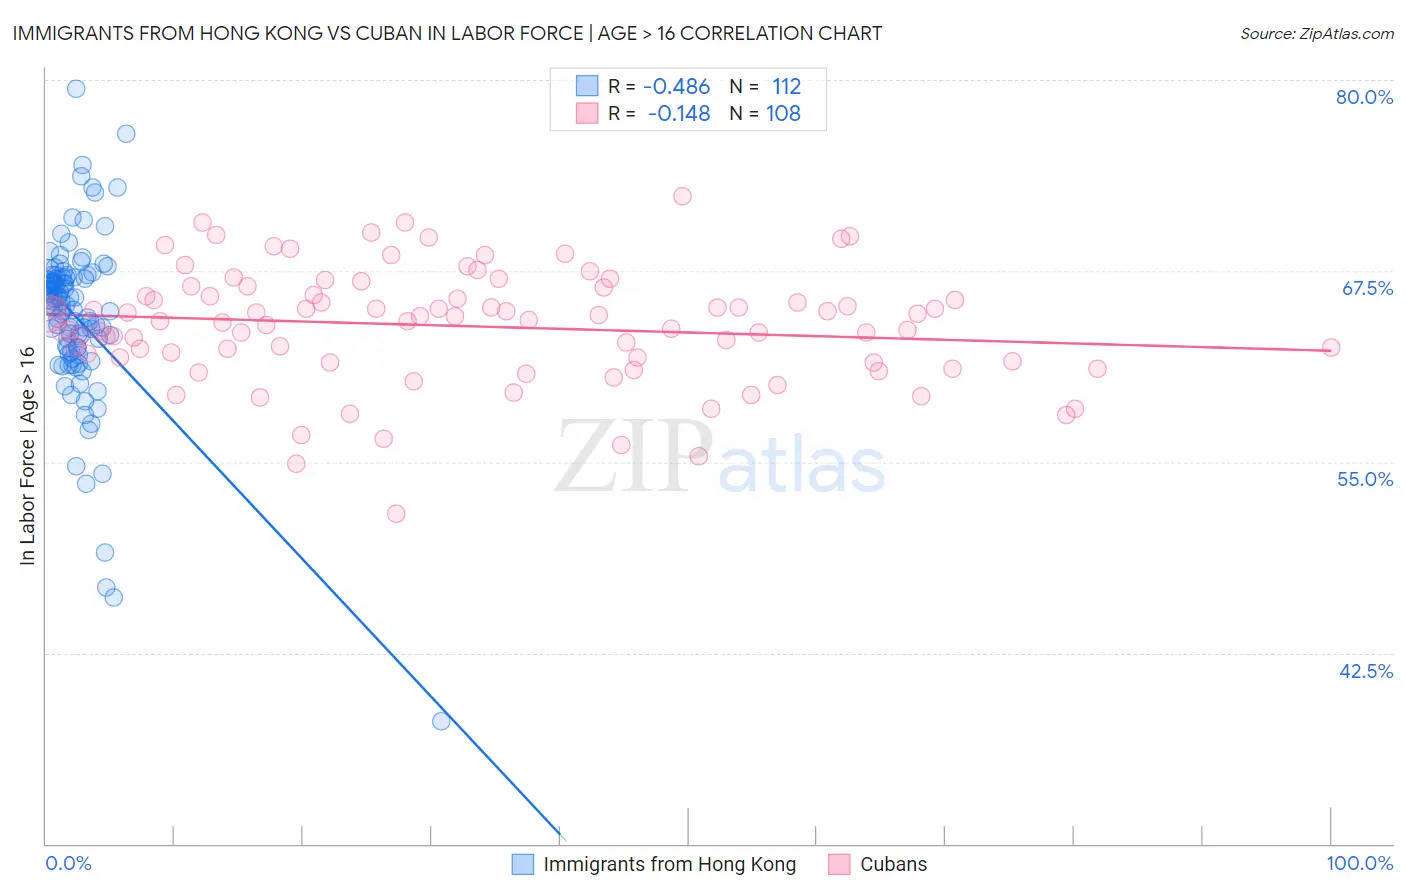
Immigrants from Hong Kong vs Cuban In Labor Force | Age > 16 Correlation Chart
The statistical analysis conducted on geographies consisting of 254,003,180 people shows a moderate negative correlation between the proportion of Immigrants from Hong Kong and labor force participation rate among population ages 16 and over in the United States with a correlation coefficient (R) of -0.486 and weighted average of 65.7%. Similarly, the statistical analysis conducted on geographies consisting of 449,375,303 people shows a poor negative correlation between the proportion of Cubans and labor force participation rate among population ages 16 and over in the United States with a correlation coefficient (R) of -0.148 and weighted average of 64.2%, a difference of 2.4%.
In Labor Force | Age > 16 Correlation Summary
| Measurement | Immigrants from Hong Kong | Cuban |
| Minimum | 38.0% | 51.6% |
| Maximum | 79.4% | 72.4% |
| Range | 41.4% | 20.8% |
| Mean | 64.4% | 63.9% |
| Median | 65.4% | 64.3% |
| Interquartile 25% (IQ1) | 62.3% | 61.7% |
| Interquartile 75% (IQ3) | 67.1% | 65.9% |
| Interquartile Range (IQR) | 4.8% | 4.2% |
| Standard Deviation (Sample) | 5.7% | 3.7% |
| Standard Deviation (Population) | 5.6% | 3.7% |
Similar Demographics by In Labor Force | Age > 16
Demographics Similar to Immigrants from Hong Kong by In Labor Force | Age > 16
In terms of in labor force | age > 16, the demographic groups most similar to Immigrants from Hong Kong are Immigrants from France (65.7%, a difference of 0.020%), New Zealander (65.7%, a difference of 0.020%), Immigrants from Ecuador (65.7%, a difference of 0.020%), Immigrants from Iran (65.7%, a difference of 0.030%), and Immigrants from Thailand (65.7%, a difference of 0.030%).
| Demographics | Rating | Rank | In Labor Force | Age > 16 |
| Pakistanis | 97.1 /100 | #113 | Exceptional 65.8% |
| Hondurans | 97.1 /100 | #114 | Exceptional 65.8% |
| Immigrants | Indonesia | 96.8 /100 | #115 | Exceptional 65.7% |
| Argentineans | 96.7 /100 | #116 | Exceptional 65.7% |
| Immigrants | Iran | 96.6 /100 | #117 | Exceptional 65.7% |
| Immigrants | Thailand | 96.6 /100 | #118 | Exceptional 65.7% |
| Immigrants | France | 96.4 /100 | #119 | Exceptional 65.7% |
| Immigrants | Hong Kong | 96.2 /100 | #120 | Exceptional 65.7% |
| New Zealanders | 96.0 /100 | #121 | Exceptional 65.7% |
| Immigrants | Ecuador | 95.9 /100 | #122 | Exceptional 65.7% |
| Immigrants | Iraq | 95.5 /100 | #123 | Exceptional 65.7% |
| Iraqis | 95.4 /100 | #124 | Exceptional 65.7% |
| Norwegians | 95.3 /100 | #125 | Exceptional 65.7% |
| Koreans | 95.3 /100 | #126 | Exceptional 65.7% |
| Immigrants | Eastern Asia | 94.9 /100 | #127 | Exceptional 65.7% |
Demographics Similar to Cubans by In Labor Force | Age > 16
In terms of in labor force | age > 16, the demographic groups most similar to Cubans are Immigrants from England (64.2%, a difference of 0.010%), Canadian (64.1%, a difference of 0.020%), Spaniard (64.1%, a difference of 0.020%), Dutch (64.2%, a difference of 0.040%), and Bahamian (64.2%, a difference of 0.060%).
| Demographics | Rating | Rank | In Labor Force | Age > 16 |
| Immigrants | Scotland | 0.8 /100 | #258 | Tragic 64.2% |
| Immigrants | Western Europe | 0.7 /100 | #259 | Tragic 64.2% |
| Marshallese | 0.7 /100 | #260 | Tragic 64.2% |
| Basques | 0.7 /100 | #261 | Tragic 64.2% |
| Finns | 0.7 /100 | #262 | Tragic 64.2% |
| Bahamians | 0.6 /100 | #263 | Tragic 64.2% |
| Dutch | 0.6 /100 | #264 | Tragic 64.2% |
| Cubans | 0.5 /100 | #265 | Tragic 64.2% |
| Immigrants | England | 0.5 /100 | #266 | Tragic 64.2% |
| Canadians | 0.5 /100 | #267 | Tragic 64.1% |
| Spaniards | 0.5 /100 | #268 | Tragic 64.1% |
| Irish | 0.4 /100 | #269 | Tragic 64.1% |
| Guyanese | 0.4 /100 | #270 | Tragic 64.1% |
| Dominicans | 0.4 /100 | #271 | Tragic 64.1% |
| Native Hawaiians | 0.3 /100 | #272 | Tragic 64.1% |