Immigrants from Switzerland vs Immigrants from Oceania In Labor Force | Age > 16
COMPARE
Immigrants from Switzerland
Immigrants from Oceania
In Labor Force | Age > 16
In Labor Force | Age > 16 Comparison
Immigrants from Switzerland
Immigrants from Oceania
65.0%
IN LABOR FORCE | AGE > 16
38.2/ 100
METRIC RATING
186th/ 347
METRIC RANK
65.5%
IN LABOR FORCE | AGE > 16
87.5/ 100
METRIC RATING
147th/ 347
METRIC RANK
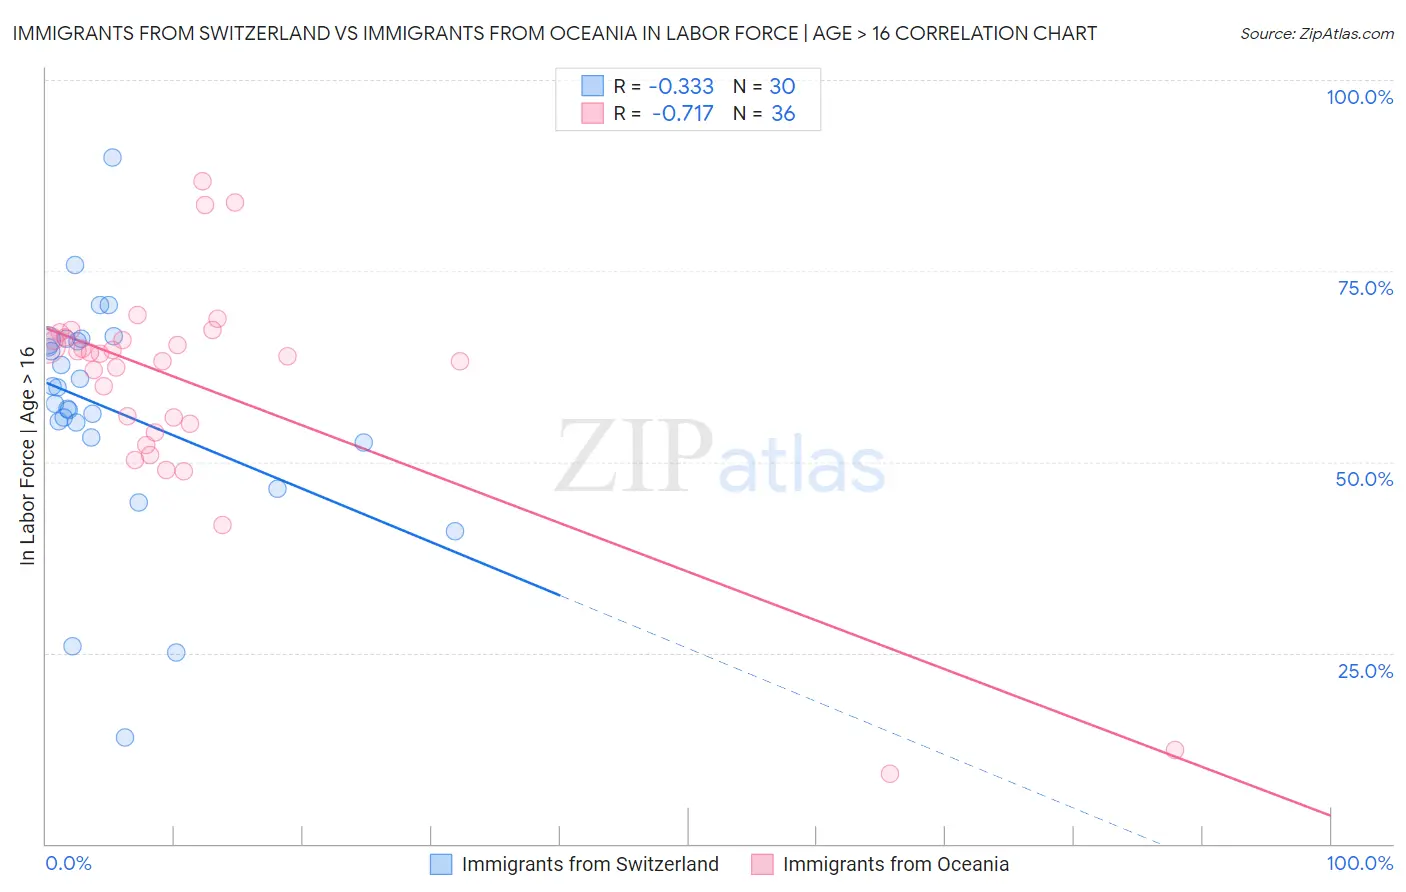
Immigrants from Switzerland vs Immigrants from Oceania In Labor Force | Age > 16 Correlation Chart
The statistical analysis conducted on geographies consisting of 148,083,583 people shows a mild negative correlation between the proportion of Immigrants from Switzerland and labor force participation rate among population ages 16 and over in the United States with a correlation coefficient (R) of -0.333 and weighted average of 65.0%. Similarly, the statistical analysis conducted on geographies consisting of 305,520,725 people shows a strong negative correlation between the proportion of Immigrants from Oceania and labor force participation rate among population ages 16 and over in the United States with a correlation coefficient (R) of -0.717 and weighted average of 65.5%, a difference of 0.68%.
In Labor Force | Age > 16 Correlation Summary
| Measurement | Immigrants from Switzerland | Immigrants from Oceania |
| Minimum | 13.9% | 9.1% |
| Maximum | 89.9% | 86.8% |
| Range | 76.0% | 77.7% |
| Mean | 56.9% | 59.8% |
| Median | 58.7% | 63.9% |
| Interquartile 25% (IQ1) | 53.2% | 54.4% |
| Interquartile 75% (IQ3) | 65.9% | 66.1% |
| Interquartile Range (IQR) | 12.7% | 11.7% |
| Standard Deviation (Sample) | 15.3% | 15.4% |
| Standard Deviation (Population) | 15.1% | 15.2% |
Similar Demographics by In Labor Force | Age > 16
Demographics Similar to Immigrants from Switzerland by In Labor Force | Age > 16
In terms of in labor force | age > 16, the demographic groups most similar to Immigrants from Switzerland are Carpatho Rusyn (65.0%, a difference of 0.020%), Syrian (65.0%, a difference of 0.020%), Immigrants from Nicaragua (65.1%, a difference of 0.030%), Soviet Union (65.0%, a difference of 0.030%), and Immigrants from Croatia (65.0%, a difference of 0.030%).
| Demographics | Rating | Rank | In Labor Force | Age > 16 |
| Immigrants | Haiti | 43.3 /100 | #179 | Average 65.1% |
| Immigrants | Latvia | 42.9 /100 | #180 | Average 65.1% |
| Immigrants | Panama | 42.4 /100 | #181 | Average 65.1% |
| Immigrants | Nicaragua | 41.1 /100 | #182 | Average 65.1% |
| Soviet Union | 40.5 /100 | #183 | Average 65.0% |
| Carpatho Rusyns | 40.0 /100 | #184 | Average 65.0% |
| Syrians | 40.0 /100 | #185 | Average 65.0% |
| Immigrants | Switzerland | 38.2 /100 | #186 | Fair 65.0% |
| Immigrants | Croatia | 35.7 /100 | #187 | Fair 65.0% |
| Immigrants | Portugal | 34.8 /100 | #188 | Fair 65.0% |
| Immigrants | Greece | 34.3 /100 | #189 | Fair 65.0% |
| Barbadians | 33.9 /100 | #190 | Fair 65.0% |
| Scandinavians | 33.7 /100 | #191 | Fair 65.0% |
| Immigrants | Fiji | 33.7 /100 | #192 | Fair 65.0% |
| Immigrants | Europe | 33.6 /100 | #193 | Fair 65.0% |
Demographics Similar to Immigrants from Oceania by In Labor Force | Age > 16
In terms of in labor force | age > 16, the demographic groups most similar to Immigrants from Oceania are Tlingit-Haida (65.5%, a difference of 0.020%), Cypriot (65.5%, a difference of 0.020%), Immigrants from Romania (65.5%, a difference of 0.030%), Bhutanese (65.5%, a difference of 0.030%), and Immigrants from Albania (65.4%, a difference of 0.040%).
| Demographics | Rating | Rank | In Labor Force | Age > 16 |
| Immigrants | Costa Rica | 90.8 /100 | #140 | Exceptional 65.5% |
| Samoans | 90.5 /100 | #141 | Exceptional 65.5% |
| Indians (Asian) | 89.5 /100 | #142 | Excellent 65.5% |
| Latvians | 89.4 /100 | #143 | Excellent 65.5% |
| Immigrants | Romania | 88.6 /100 | #144 | Excellent 65.5% |
| Tlingit-Haida | 88.3 /100 | #145 | Excellent 65.5% |
| Cypriots | 88.2 /100 | #146 | Excellent 65.5% |
| Immigrants | Oceania | 87.5 /100 | #147 | Excellent 65.5% |
| Bhutanese | 86.3 /100 | #148 | Excellent 65.5% |
| Immigrants | Albania | 85.7 /100 | #149 | Excellent 65.4% |
| Immigrants | Immigrants | 81.9 /100 | #150 | Excellent 65.4% |
| Czechs | 81.5 /100 | #151 | Excellent 65.4% |
| Yugoslavians | 81.3 /100 | #152 | Excellent 65.4% |
| Immigrants | China | 80.5 /100 | #153 | Excellent 65.4% |
| Immigrants | Eastern Europe | 78.3 /100 | #154 | Good 65.4% |