Immigrants from Eritrea vs Immigrants from North America In Labor Force | Age 20-64
COMPARE
Immigrants from Eritrea
Immigrants from North America
In Labor Force | Age 20-64
In Labor Force | Age 20-64 Comparison
Immigrants from Eritrea
Immigrants from North America
81.3%
IN LABOR FORCE | AGE 20-64
100.0/ 100
METRIC RATING
12th/ 347
METRIC RANK
79.0%
IN LABOR FORCE | AGE 20-64
2.9/ 100
METRIC RATING
237th/ 347
METRIC RANK
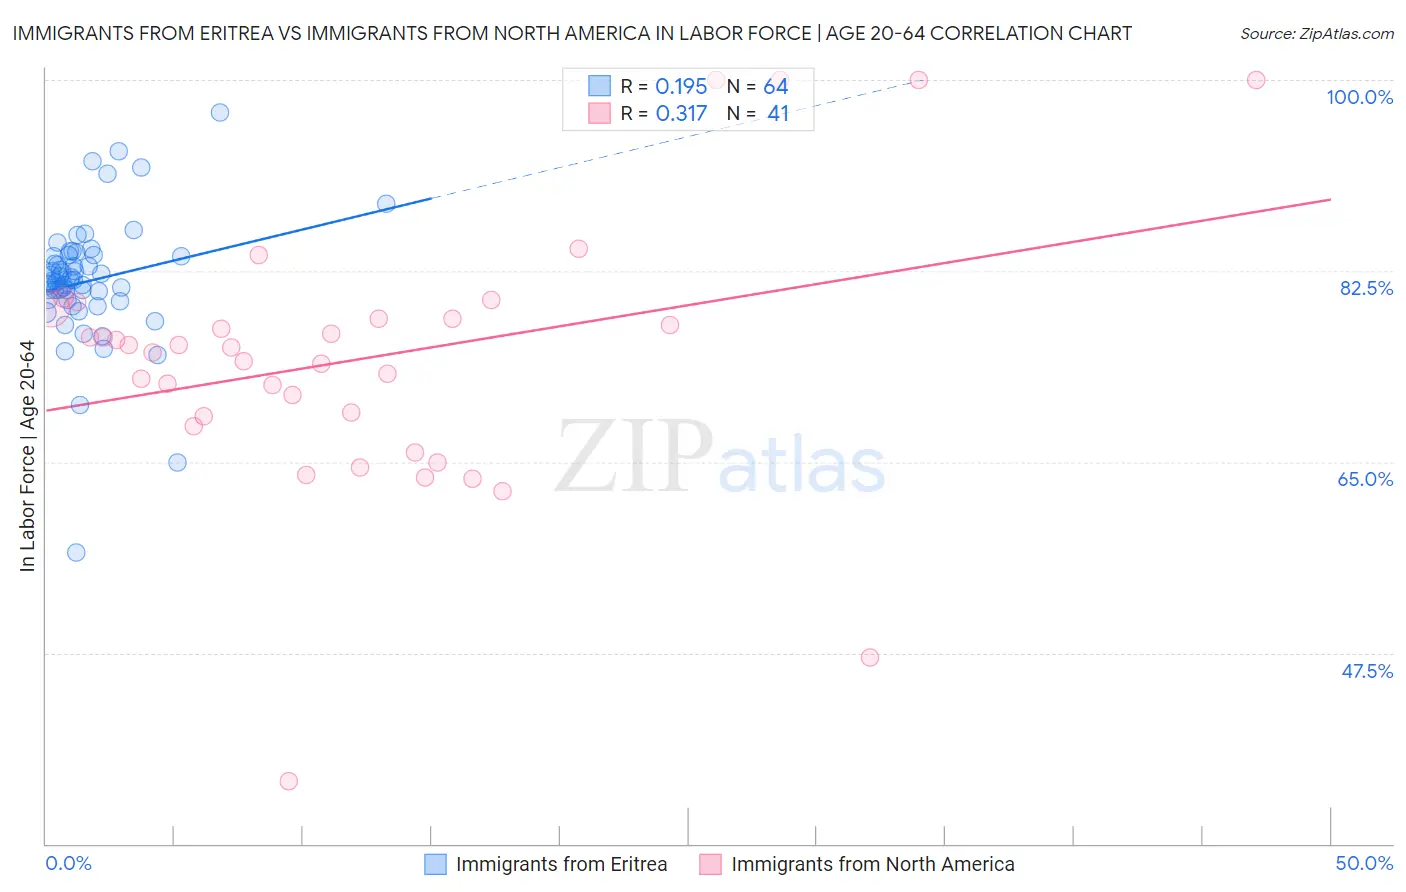
Immigrants from Eritrea vs Immigrants from North America In Labor Force | Age 20-64 Correlation Chart
The statistical analysis conducted on geographies consisting of 104,851,863 people shows a poor positive correlation between the proportion of Immigrants from Eritrea and labor force participation rate among population between the ages 20 and 64 in the United States with a correlation coefficient (R) of 0.195 and weighted average of 81.3%. Similarly, the statistical analysis conducted on geographies consisting of 462,473,604 people shows a mild positive correlation between the proportion of Immigrants from North America and labor force participation rate among population between the ages 20 and 64 in the United States with a correlation coefficient (R) of 0.317 and weighted average of 79.0%, a difference of 2.9%.
In Labor Force | Age 20-64 Correlation Summary
| Measurement | Immigrants from Eritrea | Immigrants from North America |
| Minimum | 56.7% | 35.8% |
| Maximum | 97.0% | 100.0% |
| Range | 40.3% | 64.2% |
| Mean | 81.6% | 74.5% |
| Median | 81.6% | 75.5% |
| Interquartile 25% (IQ1) | 79.9% | 68.7% |
| Interquartile 75% (IQ3) | 83.9% | 78.6% |
| Interquartile Range (IQR) | 4.1% | 9.8% |
| Standard Deviation (Sample) | 5.9% | 12.3% |
| Standard Deviation (Population) | 5.8% | 12.2% |
Similar Demographics by In Labor Force | Age 20-64
Demographics Similar to Immigrants from Eritrea by In Labor Force | Age 20-64
In terms of in labor force | age 20-64, the demographic groups most similar to Immigrants from Eritrea are Immigrants from Eastern Africa (81.3%, a difference of 0.030%), Immigrants from India (81.3%, a difference of 0.030%), Immigrants from Sierra Leone (81.5%, a difference of 0.21%), Cambodian (81.1%, a difference of 0.27%), and Bulgarian (81.1%, a difference of 0.28%).
| Demographics | Rating | Rank | In Labor Force | Age 20-64 |
| Bolivians | 100.0 /100 | #5 | Exceptional 81.7% |
| Somalis | 100.0 /100 | #6 | Exceptional 81.6% |
| Immigrants | Cameroon | 100.0 /100 | #7 | Exceptional 81.6% |
| Immigrants | Somalia | 100.0 /100 | #8 | Exceptional 81.6% |
| Sierra Leoneans | 100.0 /100 | #9 | Exceptional 81.5% |
| Immigrants | Sierra Leone | 100.0 /100 | #10 | Exceptional 81.5% |
| Immigrants | Eastern Africa | 100.0 /100 | #11 | Exceptional 81.3% |
| Immigrants | Eritrea | 100.0 /100 | #12 | Exceptional 81.3% |
| Immigrants | India | 100.0 /100 | #13 | Exceptional 81.3% |
| Cambodians | 100.0 /100 | #14 | Exceptional 81.1% |
| Bulgarians | 100.0 /100 | #15 | Exceptional 81.1% |
| Immigrants | Nepal | 100.0 /100 | #16 | Exceptional 81.1% |
| Norwegians | 100.0 /100 | #17 | Exceptional 81.0% |
| Immigrants | Bulgaria | 100.0 /100 | #18 | Exceptional 81.0% |
| Zimbabweans | 100.0 /100 | #19 | Exceptional 81.0% |
Demographics Similar to Immigrants from North America by In Labor Force | Age 20-64
In terms of in labor force | age 20-64, the demographic groups most similar to Immigrants from North America are Samoan (79.0%, a difference of 0.0%), Immigrants from Canada (79.0%, a difference of 0.020%), Tlingit-Haida (79.0%, a difference of 0.020%), Immigrants from Jamaica (79.0%, a difference of 0.020%), and Welsh (79.0%, a difference of 0.040%).
| Demographics | Rating | Rank | In Labor Force | Age 20-64 |
| Native Hawaiians | 5.6 /100 | #230 | Tragic 79.1% |
| Lebanese | 5.1 /100 | #231 | Tragic 79.1% |
| Guamanians/Chamorros | 4.5 /100 | #232 | Tragic 79.1% |
| Japanese | 4.0 /100 | #233 | Tragic 79.1% |
| Immigrants | Canada | 3.2 /100 | #234 | Tragic 79.0% |
| Tlingit-Haida | 3.2 /100 | #235 | Tragic 79.0% |
| Samoans | 2.9 /100 | #236 | Tragic 79.0% |
| Immigrants | North America | 2.9 /100 | #237 | Tragic 79.0% |
| Immigrants | Jamaica | 2.6 /100 | #238 | Tragic 79.0% |
| Welsh | 2.4 /100 | #239 | Tragic 79.0% |
| Trinidadians and Tobagonians | 2.3 /100 | #240 | Tragic 79.0% |
| Jamaicans | 2.0 /100 | #241 | Tragic 78.9% |
| Immigrants | Micronesia | 1.9 /100 | #242 | Tragic 78.9% |
| Immigrants | West Indies | 1.7 /100 | #243 | Tragic 78.9% |
| French | 1.5 /100 | #244 | Tragic 78.9% |