Immigrants from Eritrea vs South American In Labor Force | Age 20-64
COMPARE
Immigrants from Eritrea
South American
In Labor Force | Age 20-64
In Labor Force | Age 20-64 Comparison
Immigrants from Eritrea
South Americans
81.3%
IN LABOR FORCE | AGE 20-64
100.0/ 100
METRIC RATING
12th/ 347
METRIC RANK
80.1%
IN LABOR FORCE | AGE 20-64
95.9/ 100
METRIC RATING
97th/ 347
METRIC RANK
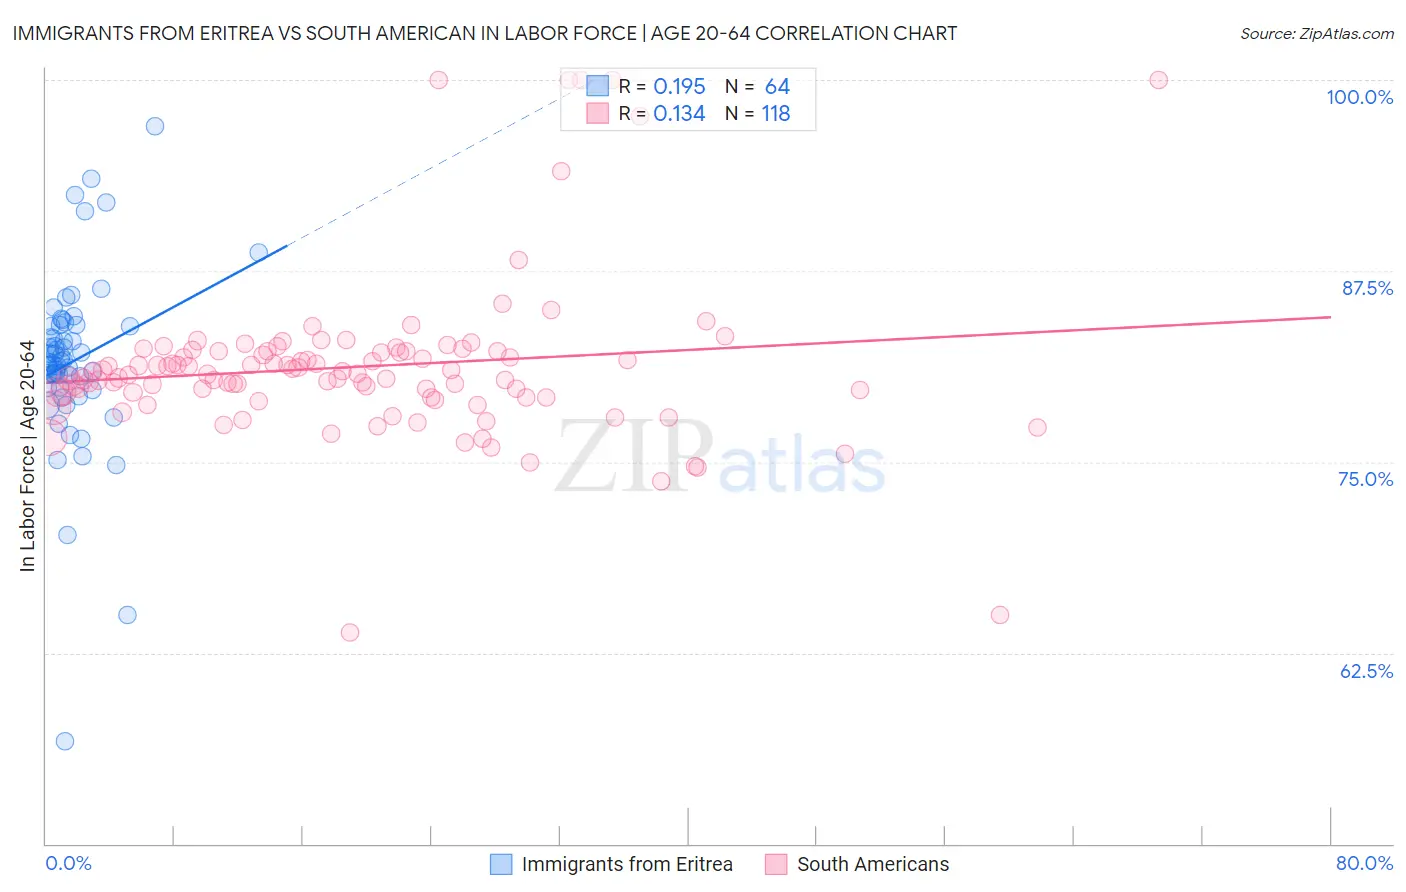
Immigrants from Eritrea vs South American In Labor Force | Age 20-64 Correlation Chart
The statistical analysis conducted on geographies consisting of 104,851,863 people shows a poor positive correlation between the proportion of Immigrants from Eritrea and labor force participation rate among population between the ages 20 and 64 in the United States with a correlation coefficient (R) of 0.195 and weighted average of 81.3%. Similarly, the statistical analysis conducted on geographies consisting of 494,183,783 people shows a poor positive correlation between the proportion of South Americans and labor force participation rate among population between the ages 20 and 64 in the United States with a correlation coefficient (R) of 0.134 and weighted average of 80.1%, a difference of 1.5%.
In Labor Force | Age 20-64 Correlation Summary
| Measurement | Immigrants from Eritrea | South American |
| Minimum | 56.7% | 63.8% |
| Maximum | 97.0% | 100.0% |
| Range | 40.3% | 36.2% |
| Mean | 81.6% | 81.2% |
| Median | 81.6% | 80.7% |
| Interquartile 25% (IQ1) | 79.9% | 79.2% |
| Interquartile 75% (IQ3) | 83.9% | 82.2% |
| Interquartile Range (IQR) | 4.1% | 3.0% |
| Standard Deviation (Sample) | 5.9% | 5.4% |
| Standard Deviation (Population) | 5.8% | 5.4% |
Similar Demographics by In Labor Force | Age 20-64
Demographics Similar to Immigrants from Eritrea by In Labor Force | Age 20-64
In terms of in labor force | age 20-64, the demographic groups most similar to Immigrants from Eritrea are Immigrants from Eastern Africa (81.3%, a difference of 0.030%), Immigrants from India (81.3%, a difference of 0.030%), Immigrants from Sierra Leone (81.5%, a difference of 0.21%), Cambodian (81.1%, a difference of 0.27%), and Bulgarian (81.1%, a difference of 0.28%).
| Demographics | Rating | Rank | In Labor Force | Age 20-64 |
| Bolivians | 100.0 /100 | #5 | Exceptional 81.7% |
| Somalis | 100.0 /100 | #6 | Exceptional 81.6% |
| Immigrants | Cameroon | 100.0 /100 | #7 | Exceptional 81.6% |
| Immigrants | Somalia | 100.0 /100 | #8 | Exceptional 81.6% |
| Sierra Leoneans | 100.0 /100 | #9 | Exceptional 81.5% |
| Immigrants | Sierra Leone | 100.0 /100 | #10 | Exceptional 81.5% |
| Immigrants | Eastern Africa | 100.0 /100 | #11 | Exceptional 81.3% |
| Immigrants | Eritrea | 100.0 /100 | #12 | Exceptional 81.3% |
| Immigrants | India | 100.0 /100 | #13 | Exceptional 81.3% |
| Cambodians | 100.0 /100 | #14 | Exceptional 81.1% |
| Bulgarians | 100.0 /100 | #15 | Exceptional 81.1% |
| Immigrants | Nepal | 100.0 /100 | #16 | Exceptional 81.1% |
| Norwegians | 100.0 /100 | #17 | Exceptional 81.0% |
| Immigrants | Bulgaria | 100.0 /100 | #18 | Exceptional 81.0% |
| Zimbabweans | 100.0 /100 | #19 | Exceptional 81.0% |
Demographics Similar to South Americans by In Labor Force | Age 20-64
In terms of in labor force | age 20-64, the demographic groups most similar to South Americans are Yugoslavian (80.1%, a difference of 0.0%), Immigrants from Malaysia (80.1%, a difference of 0.0%), Immigrants from Uruguay (80.1%, a difference of 0.0%), Immigrants from Asia (80.1%, a difference of 0.010%), and Immigrants from Chile (80.1%, a difference of 0.010%).
| Demographics | Rating | Rank | In Labor Force | Age 20-64 |
| Poles | 96.8 /100 | #90 | Exceptional 80.1% |
| Uruguayans | 96.7 /100 | #91 | Exceptional 80.1% |
| Ghanaians | 96.7 /100 | #92 | Exceptional 80.1% |
| Immigrants | Belarus | 96.4 /100 | #93 | Exceptional 80.1% |
| Immigrants | Asia | 96.0 /100 | #94 | Exceptional 80.1% |
| Yugoslavians | 95.9 /100 | #95 | Exceptional 80.1% |
| Immigrants | Malaysia | 95.9 /100 | #96 | Exceptional 80.1% |
| South Americans | 95.9 /100 | #97 | Exceptional 80.1% |
| Immigrants | Uruguay | 95.8 /100 | #98 | Exceptional 80.1% |
| Immigrants | Chile | 95.7 /100 | #99 | Exceptional 80.1% |
| Filipinos | 95.6 /100 | #100 | Exceptional 80.1% |
| Palestinians | 95.5 /100 | #101 | Exceptional 80.0% |
| Immigrants | Australia | 95.5 /100 | #102 | Exceptional 80.0% |
| Russians | 95.5 /100 | #103 | Exceptional 80.0% |
| Venezuelans | 95.3 /100 | #104 | Exceptional 80.0% |