Immigrants from Eritrea vs Nepalese In Labor Force | Age 20-64
COMPARE
Immigrants from Eritrea
Nepalese
In Labor Force | Age 20-64
In Labor Force | Age 20-64 Comparison
Immigrants from Eritrea
Nepalese
81.3%
IN LABOR FORCE | AGE 20-64
100.0/ 100
METRIC RATING
12th/ 347
METRIC RANK
77.5%
IN LABOR FORCE | AGE 20-64
0.0/ 100
METRIC RATING
301st/ 347
METRIC RANK
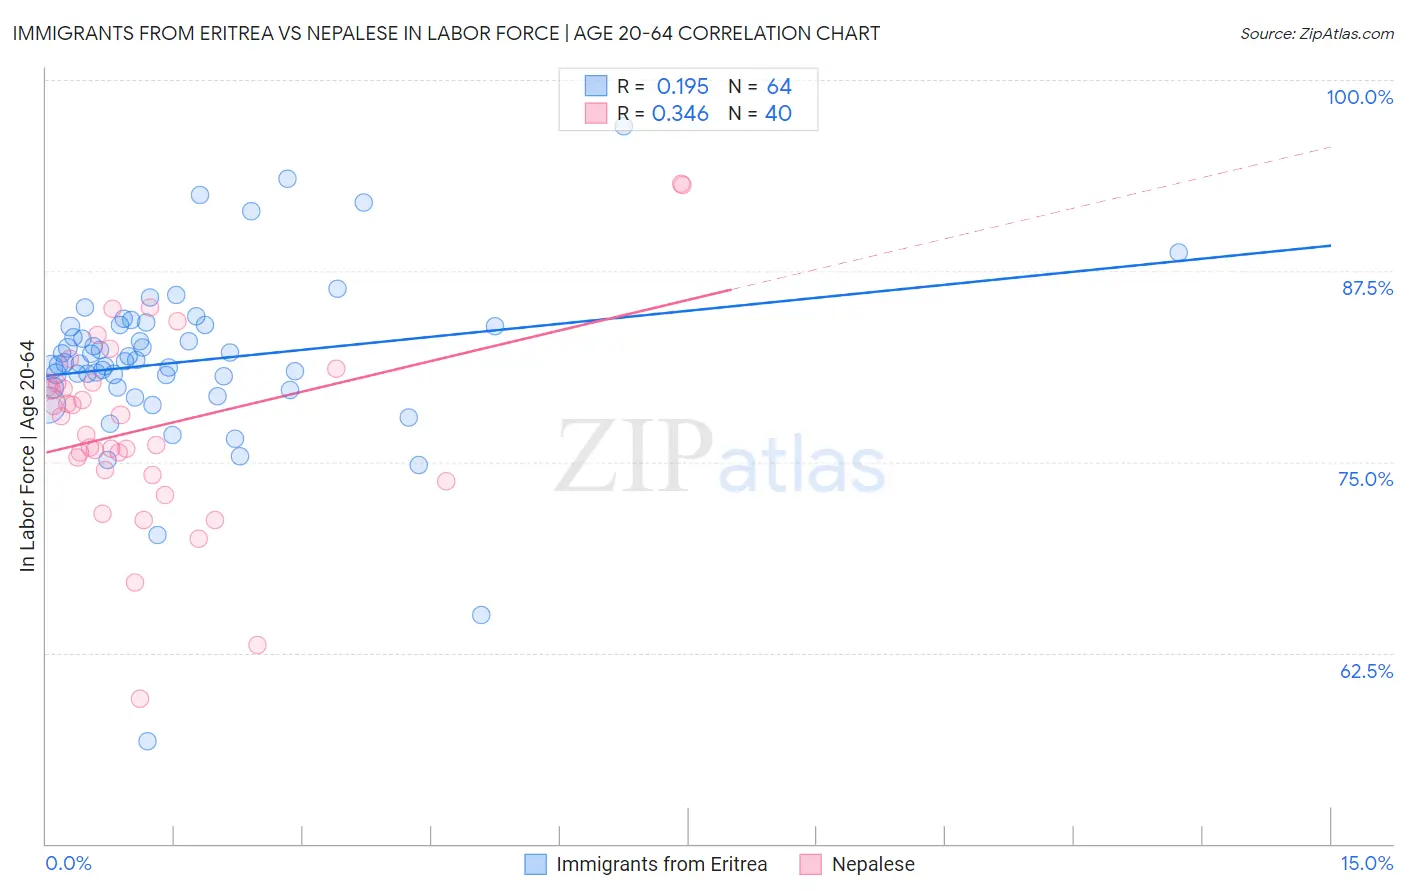
Immigrants from Eritrea vs Nepalese In Labor Force | Age 20-64 Correlation Chart
The statistical analysis conducted on geographies consisting of 104,851,863 people shows a poor positive correlation between the proportion of Immigrants from Eritrea and labor force participation rate among population between the ages 20 and 64 in the United States with a correlation coefficient (R) of 0.195 and weighted average of 81.3%. Similarly, the statistical analysis conducted on geographies consisting of 24,521,755 people shows a mild positive correlation between the proportion of Nepalese and labor force participation rate among population between the ages 20 and 64 in the United States with a correlation coefficient (R) of 0.346 and weighted average of 77.5%, a difference of 4.9%.
In Labor Force | Age 20-64 Correlation Summary
| Measurement | Immigrants from Eritrea | Nepalese |
| Minimum | 56.7% | 59.5% |
| Maximum | 97.0% | 93.2% |
| Range | 40.3% | 33.7% |
| Mean | 81.6% | 77.3% |
| Median | 81.6% | 77.4% |
| Interquartile 25% (IQ1) | 79.9% | 74.3% |
| Interquartile 75% (IQ3) | 83.9% | 80.2% |
| Interquartile Range (IQR) | 4.1% | 5.9% |
| Standard Deviation (Sample) | 5.9% | 6.5% |
| Standard Deviation (Population) | 5.8% | 6.5% |
Similar Demographics by In Labor Force | Age 20-64
Demographics Similar to Immigrants from Eritrea by In Labor Force | Age 20-64
In terms of in labor force | age 20-64, the demographic groups most similar to Immigrants from Eritrea are Immigrants from Eastern Africa (81.3%, a difference of 0.030%), Immigrants from India (81.3%, a difference of 0.030%), Immigrants from Sierra Leone (81.5%, a difference of 0.21%), Cambodian (81.1%, a difference of 0.27%), and Bulgarian (81.1%, a difference of 0.28%).
| Demographics | Rating | Rank | In Labor Force | Age 20-64 |
| Bolivians | 100.0 /100 | #5 | Exceptional 81.7% |
| Somalis | 100.0 /100 | #6 | Exceptional 81.6% |
| Immigrants | Cameroon | 100.0 /100 | #7 | Exceptional 81.6% |
| Immigrants | Somalia | 100.0 /100 | #8 | Exceptional 81.6% |
| Sierra Leoneans | 100.0 /100 | #9 | Exceptional 81.5% |
| Immigrants | Sierra Leone | 100.0 /100 | #10 | Exceptional 81.5% |
| Immigrants | Eastern Africa | 100.0 /100 | #11 | Exceptional 81.3% |
| Immigrants | Eritrea | 100.0 /100 | #12 | Exceptional 81.3% |
| Immigrants | India | 100.0 /100 | #13 | Exceptional 81.3% |
| Cambodians | 100.0 /100 | #14 | Exceptional 81.1% |
| Bulgarians | 100.0 /100 | #15 | Exceptional 81.1% |
| Immigrants | Nepal | 100.0 /100 | #16 | Exceptional 81.1% |
| Norwegians | 100.0 /100 | #17 | Exceptional 81.0% |
| Immigrants | Bulgaria | 100.0 /100 | #18 | Exceptional 81.0% |
| Zimbabweans | 100.0 /100 | #19 | Exceptional 81.0% |
Demographics Similar to Nepalese by In Labor Force | Age 20-64
In terms of in labor force | age 20-64, the demographic groups most similar to Nepalese are Spanish American Indian (77.6%, a difference of 0.040%), Iroquois (77.5%, a difference of 0.050%), Hispanic or Latino (77.6%, a difference of 0.11%), Cree (77.7%, a difference of 0.17%), and Immigrants from Dominican Republic (77.7%, a difference of 0.18%).
| Demographics | Rating | Rank | In Labor Force | Age 20-64 |
| Immigrants | Central America | 0.0 /100 | #294 | Tragic 77.7% |
| Immigrants | Grenada | 0.0 /100 | #295 | Tragic 77.7% |
| Immigrants | Dominican Republic | 0.0 /100 | #296 | Tragic 77.7% |
| Dominicans | 0.0 /100 | #297 | Tragic 77.7% |
| Cree | 0.0 /100 | #298 | Tragic 77.7% |
| Hispanics or Latinos | 0.0 /100 | #299 | Tragic 77.6% |
| Spanish American Indians | 0.0 /100 | #300 | Tragic 77.6% |
| Nepalese | 0.0 /100 | #301 | Tragic 77.5% |
| Iroquois | 0.0 /100 | #302 | Tragic 77.5% |
| Chippewa | 0.0 /100 | #303 | Tragic 77.3% |
| Immigrants | Mexico | 0.0 /100 | #304 | Tragic 77.3% |
| Mexicans | 0.0 /100 | #305 | Tragic 77.2% |
| Potawatomi | 0.0 /100 | #306 | Tragic 77.2% |
| Central American Indians | 0.0 /100 | #307 | Tragic 77.1% |
| Alaska Natives | 0.0 /100 | #308 | Tragic 77.0% |