Immigrants from Eritrea vs Yuman In Labor Force | Age 16-19
COMPARE
Immigrants from Eritrea
Yuman
In Labor Force | Age 16-19
In Labor Force | Age 16-19 Comparison
Immigrants from Eritrea
Yuman
38.7%
IN LABOR FORCE | AGE 16-19
99.0/ 100
METRIC RATING
104th/ 347
METRIC RANK
27.7%
IN LABOR FORCE | AGE 16-19
0.0/ 100
METRIC RATING
343rd/ 347
METRIC RANK
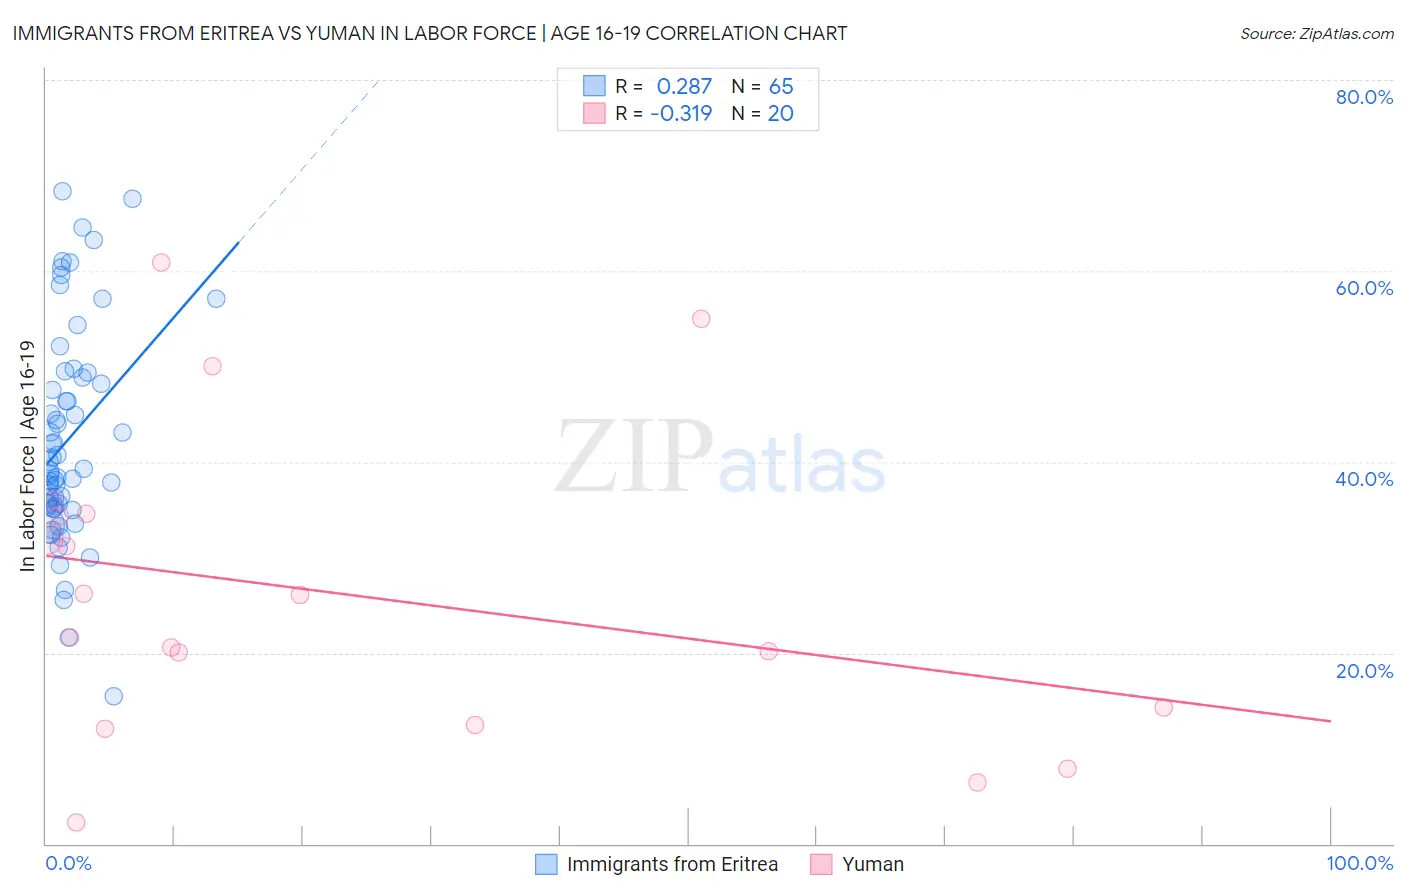
Immigrants from Eritrea vs Yuman In Labor Force | Age 16-19 Correlation Chart
The statistical analysis conducted on geographies consisting of 104,843,634 people shows a weak positive correlation between the proportion of Immigrants from Eritrea and labor force participation rate among population between the ages 16 and 19 in the United States with a correlation coefficient (R) of 0.287 and weighted average of 38.7%. Similarly, the statistical analysis conducted on geographies consisting of 40,663,980 people shows a mild negative correlation between the proportion of Yuman and labor force participation rate among population between the ages 16 and 19 in the United States with a correlation coefficient (R) of -0.319 and weighted average of 27.7%, a difference of 39.9%.
In Labor Force | Age 16-19 Correlation Summary
| Measurement | Immigrants from Eritrea | Yuman |
| Minimum | 15.4% | 2.2% |
| Maximum | 68.4% | 60.9% |
| Range | 53.0% | 58.7% |
| Mean | 42.4% | 26.2% |
| Median | 39.2% | 23.8% |
| Interquartile 25% (IQ1) | 35.3% | 13.4% |
| Interquartile 75% (IQ3) | 49.1% | 34.5% |
| Interquartile Range (IQR) | 13.9% | 21.1% |
| Standard Deviation (Sample) | 11.3% | 16.0% |
| Standard Deviation (Population) | 11.2% | 15.6% |
Similar Demographics by In Labor Force | Age 16-19
Demographics Similar to Immigrants from Eritrea by In Labor Force | Age 16-19
In terms of in labor force | age 16-19, the demographic groups most similar to Immigrants from Eritrea are Immigrants from Cameroon (38.7%, a difference of 0.050%), Hmong (38.7%, a difference of 0.090%), Zimbabwean (38.7%, a difference of 0.090%), Immigrants from Thailand (38.7%, a difference of 0.16%), and Iraqi (38.6%, a difference of 0.16%).
| Demographics | Rating | Rank | In Labor Force | Age 16-19 |
| Greeks | 99.3 /100 | #97 | Exceptional 38.9% |
| Ugandans | 99.3 /100 | #98 | Exceptional 38.9% |
| Immigrants | North Macedonia | 99.3 /100 | #99 | Exceptional 38.9% |
| Immigrants | Thailand | 99.1 /100 | #100 | Exceptional 38.7% |
| Hmong | 99.1 /100 | #101 | Exceptional 38.7% |
| Zimbabweans | 99.1 /100 | #102 | Exceptional 38.7% |
| Immigrants | Cameroon | 99.0 /100 | #103 | Exceptional 38.7% |
| Immigrants | Eritrea | 99.0 /100 | #104 | Exceptional 38.7% |
| Iraqis | 98.9 /100 | #105 | Exceptional 38.6% |
| Delaware | 98.8 /100 | #106 | Exceptional 38.6% |
| Chinese | 98.8 /100 | #107 | Exceptional 38.6% |
| Immigrants | Ethiopia | 98.7 /100 | #108 | Exceptional 38.6% |
| Lebanese | 98.7 /100 | #109 | Exceptional 38.6% |
| Maltese | 98.6 /100 | #110 | Exceptional 38.5% |
| Crow | 98.5 /100 | #111 | Exceptional 38.5% |
Demographics Similar to Yuman by In Labor Force | Age 16-19
In terms of in labor force | age 16-19, the demographic groups most similar to Yuman are Guyanese (27.4%, a difference of 0.76%), Immigrants from Guyana (27.3%, a difference of 1.4%), Immigrants from Barbados (29.0%, a difference of 4.8%), Immigrants from Armenia (29.0%, a difference of 5.0%), and British West Indian (29.1%, a difference of 5.2%).
| Demographics | Rating | Rank | In Labor Force | Age 16-19 |
| Immigrants | Hong Kong | 0.0 /100 | #333 | Tragic 30.5% |
| Puerto Ricans | 0.0 /100 | #334 | Tragic 30.3% |
| Immigrants | Cuba | 0.0 /100 | #335 | Tragic 30.2% |
| Immigrants | Trinidad and Tobago | 0.0 /100 | #336 | Tragic 30.2% |
| Immigrants | Bangladesh | 0.0 /100 | #337 | Tragic 30.0% |
| Vietnamese | 0.0 /100 | #338 | Tragic 29.6% |
| Immigrants | Uzbekistan | 0.0 /100 | #339 | Tragic 29.2% |
| British West Indians | 0.0 /100 | #340 | Tragic 29.1% |
| Immigrants | Armenia | 0.0 /100 | #341 | Tragic 29.0% |
| Immigrants | Barbados | 0.0 /100 | #342 | Tragic 29.0% |
| Yuman | 0.0 /100 | #343 | Tragic 27.7% |
| Guyanese | 0.0 /100 | #344 | Tragic 27.4% |
| Immigrants | Guyana | 0.0 /100 | #345 | Tragic 27.3% |
| Immigrants | St. Vincent and the Grenadines | 0.0 /100 | #346 | Tragic 26.3% |
| Immigrants | Grenada | 0.0 /100 | #347 | Tragic 25.4% |