Immigrants from Eritrea vs Cherokee In Labor Force | Age 16-19
COMPARE
Immigrants from Eritrea
Cherokee
In Labor Force | Age 16-19
In Labor Force | Age 16-19 Comparison
Immigrants from Eritrea
Cherokee
38.7%
IN LABOR FORCE | AGE 16-19
99.0/ 100
METRIC RATING
104th/ 347
METRIC RANK
40.2%
IN LABOR FORCE | AGE 16-19
100.0/ 100
METRIC RATING
62nd/ 347
METRIC RANK
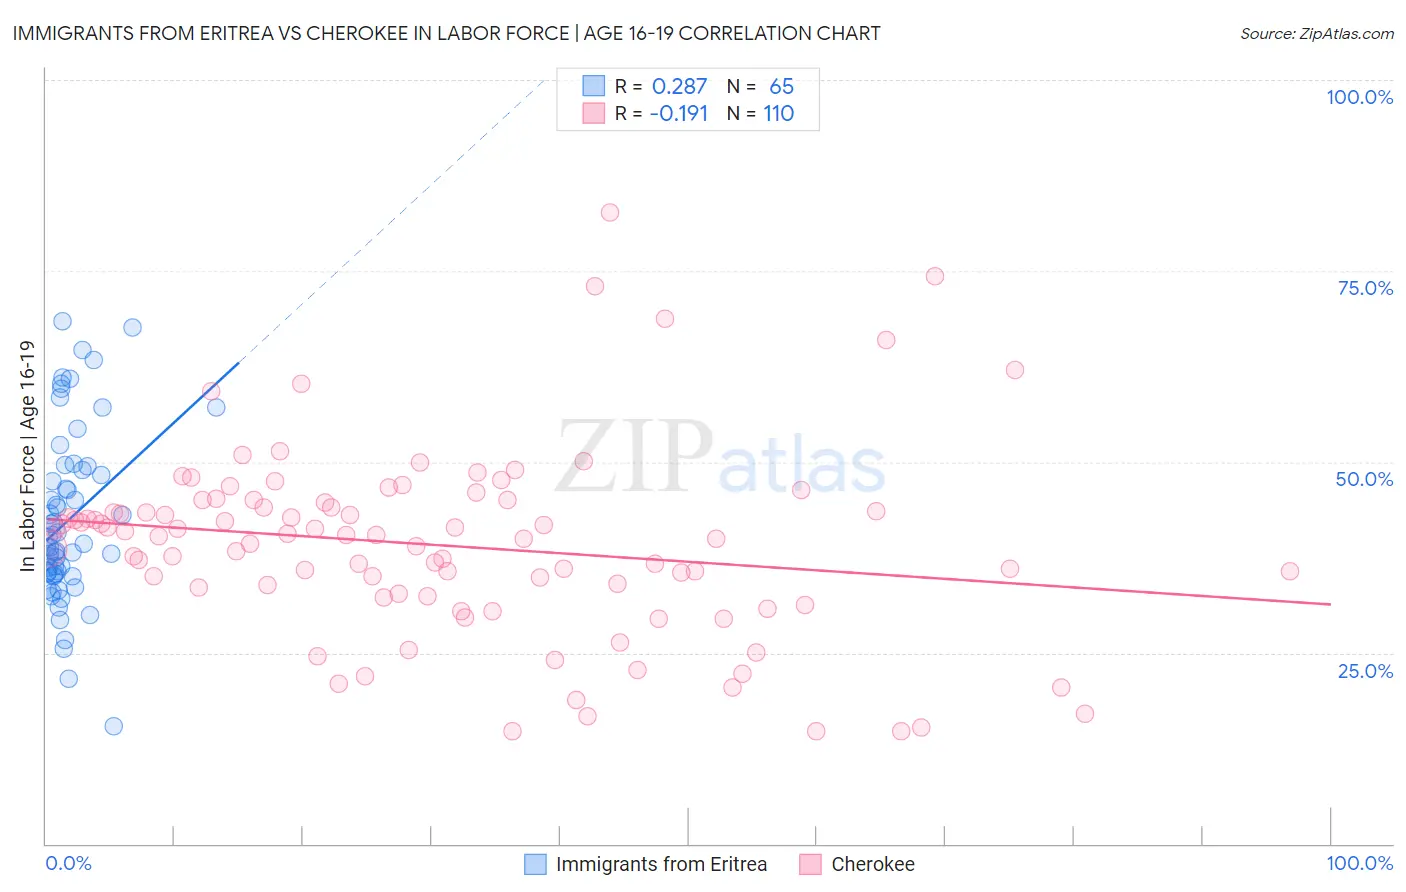
Immigrants from Eritrea vs Cherokee In Labor Force | Age 16-19 Correlation Chart
The statistical analysis conducted on geographies consisting of 104,843,634 people shows a weak positive correlation between the proportion of Immigrants from Eritrea and labor force participation rate among population between the ages 16 and 19 in the United States with a correlation coefficient (R) of 0.287 and weighted average of 38.7%. Similarly, the statistical analysis conducted on geographies consisting of 492,065,053 people shows a poor negative correlation between the proportion of Cherokee and labor force participation rate among population between the ages 16 and 19 in the United States with a correlation coefficient (R) of -0.191 and weighted average of 40.2%, a difference of 4.0%.
In Labor Force | Age 16-19 Correlation Summary
| Measurement | Immigrants from Eritrea | Cherokee |
| Minimum | 15.4% | 14.7% |
| Maximum | 68.4% | 82.7% |
| Range | 53.0% | 68.0% |
| Mean | 42.4% | 39.1% |
| Median | 39.2% | 40.3% |
| Interquartile 25% (IQ1) | 35.3% | 32.8% |
| Interquartile 75% (IQ3) | 49.1% | 44.6% |
| Interquartile Range (IQR) | 13.9% | 11.9% |
| Standard Deviation (Sample) | 11.3% | 12.3% |
| Standard Deviation (Population) | 11.2% | 12.3% |
Similar Demographics by In Labor Force | Age 16-19
Demographics Similar to Immigrants from Eritrea by In Labor Force | Age 16-19
In terms of in labor force | age 16-19, the demographic groups most similar to Immigrants from Eritrea are Immigrants from Cameroon (38.7%, a difference of 0.050%), Hmong (38.7%, a difference of 0.090%), Zimbabwean (38.7%, a difference of 0.090%), Immigrants from Thailand (38.7%, a difference of 0.16%), and Iraqi (38.6%, a difference of 0.16%).
| Demographics | Rating | Rank | In Labor Force | Age 16-19 |
| Greeks | 99.3 /100 | #97 | Exceptional 38.9% |
| Ugandans | 99.3 /100 | #98 | Exceptional 38.9% |
| Immigrants | North Macedonia | 99.3 /100 | #99 | Exceptional 38.9% |
| Immigrants | Thailand | 99.1 /100 | #100 | Exceptional 38.7% |
| Hmong | 99.1 /100 | #101 | Exceptional 38.7% |
| Zimbabweans | 99.1 /100 | #102 | Exceptional 38.7% |
| Immigrants | Cameroon | 99.0 /100 | #103 | Exceptional 38.7% |
| Immigrants | Eritrea | 99.0 /100 | #104 | Exceptional 38.7% |
| Iraqis | 98.9 /100 | #105 | Exceptional 38.6% |
| Delaware | 98.8 /100 | #106 | Exceptional 38.6% |
| Chinese | 98.8 /100 | #107 | Exceptional 38.6% |
| Immigrants | Ethiopia | 98.7 /100 | #108 | Exceptional 38.6% |
| Lebanese | 98.7 /100 | #109 | Exceptional 38.6% |
| Maltese | 98.6 /100 | #110 | Exceptional 38.5% |
| Crow | 98.5 /100 | #111 | Exceptional 38.5% |
Demographics Similar to Cherokee by In Labor Force | Age 16-19
In terms of in labor force | age 16-19, the demographic groups most similar to Cherokee are Northern European (40.2%, a difference of 0.060%), American (40.3%, a difference of 0.14%), Immigrants from Micronesia (40.2%, a difference of 0.17%), Kenyan (40.1%, a difference of 0.25%), and Immigrants from Eastern Africa (40.4%, a difference of 0.29%).
| Demographics | Rating | Rank | In Labor Force | Age 16-19 |
| British | 100.0 /100 | #55 | Exceptional 40.5% |
| Fijians | 100.0 /100 | #56 | Exceptional 40.4% |
| Lithuanians | 100.0 /100 | #57 | Exceptional 40.4% |
| Aleuts | 100.0 /100 | #58 | Exceptional 40.4% |
| Slavs | 100.0 /100 | #59 | Exceptional 40.4% |
| Immigrants | Eastern Africa | 100.0 /100 | #60 | Exceptional 40.4% |
| Americans | 100.0 /100 | #61 | Exceptional 40.3% |
| Cherokee | 100.0 /100 | #62 | Exceptional 40.2% |
| Northern Europeans | 100.0 /100 | #63 | Exceptional 40.2% |
| Immigrants | Micronesia | 100.0 /100 | #64 | Exceptional 40.2% |
| Kenyans | 100.0 /100 | #65 | Exceptional 40.1% |
| Immigrants | Nonimmigrants | 100.0 /100 | #66 | Exceptional 40.1% |
| Canadians | 100.0 /100 | #67 | Exceptional 40.1% |
| Italians | 99.9 /100 | #68 | Exceptional 40.1% |
| Potawatomi | 99.9 /100 | #69 | Exceptional 40.0% |