Immigrants from Bulgaria vs Sudanese In Labor Force | Age 16-19
COMPARE
Immigrants from Bulgaria
Sudanese
In Labor Force | Age 16-19
In Labor Force | Age 16-19 Comparison
Immigrants from Bulgaria
Sudanese
37.3%
IN LABOR FORCE | AGE 16-19
81.6/ 100
METRIC RATING
154th/ 347
METRIC RANK
42.9%
IN LABOR FORCE | AGE 16-19
100.0/ 100
METRIC RATING
22nd/ 347
METRIC RANK
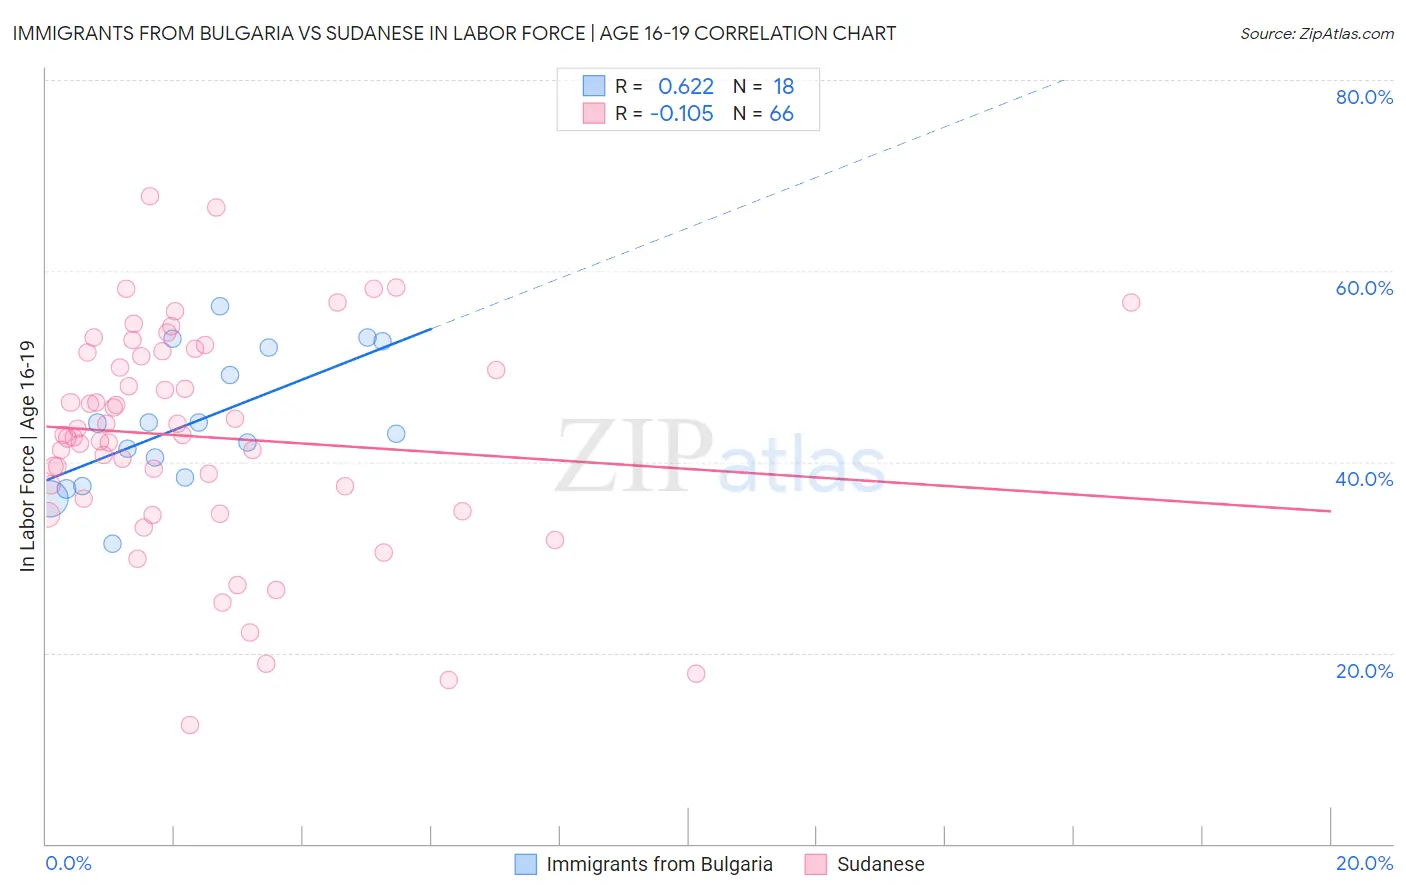
Immigrants from Bulgaria vs Sudanese In Labor Force | Age 16-19 Correlation Chart
The statistical analysis conducted on geographies consisting of 172,373,837 people shows a significant positive correlation between the proportion of Immigrants from Bulgaria and labor force participation rate among population between the ages 16 and 19 in the United States with a correlation coefficient (R) of 0.622 and weighted average of 37.3%. Similarly, the statistical analysis conducted on geographies consisting of 110,142,178 people shows a poor negative correlation between the proportion of Sudanese and labor force participation rate among population between the ages 16 and 19 in the United States with a correlation coefficient (R) of -0.105 and weighted average of 42.9%, a difference of 15.0%.
In Labor Force | Age 16-19 Correlation Summary
| Measurement | Immigrants from Bulgaria | Sudanese |
| Minimum | 31.4% | 12.5% |
| Maximum | 56.3% | 67.8% |
| Range | 24.8% | 55.3% |
| Mean | 44.2% | 42.6% |
| Median | 43.5% | 42.8% |
| Interquartile 25% (IQ1) | 38.4% | 36.1% |
| Interquartile 75% (IQ3) | 52.0% | 51.4% |
| Interquartile Range (IQR) | 13.6% | 15.3% |
| Standard Deviation (Sample) | 7.0% | 11.5% |
| Standard Deviation (Population) | 6.8% | 11.4% |
Similar Demographics by In Labor Force | Age 16-19
Demographics Similar to Immigrants from Bulgaria by In Labor Force | Age 16-19
In terms of in labor force | age 16-19, the demographic groups most similar to Immigrants from Bulgaria are Arapaho (37.3%, a difference of 0.020%), Immigrants from Lithuania (37.2%, a difference of 0.070%), Kiowa (37.2%, a difference of 0.10%), Immigrants from Sierra Leone (37.3%, a difference of 0.17%), and Immigrants from Poland (37.3%, a difference of 0.25%).
| Demographics | Rating | Rank | In Labor Force | Age 16-19 |
| Brazilians | 88.7 /100 | #147 | Excellent 37.5% |
| Romanians | 87.3 /100 | #148 | Excellent 37.5% |
| Native Hawaiians | 85.0 /100 | #149 | Excellent 37.4% |
| Tsimshian | 84.7 /100 | #150 | Excellent 37.4% |
| Immigrants | Poland | 84.4 /100 | #151 | Excellent 37.3% |
| Immigrants | Sierra Leone | 83.6 /100 | #152 | Excellent 37.3% |
| Arapaho | 81.8 /100 | #153 | Excellent 37.3% |
| Immigrants | Bulgaria | 81.6 /100 | #154 | Excellent 37.3% |
| Immigrants | Lithuania | 80.7 /100 | #155 | Excellent 37.2% |
| Kiowa | 80.4 /100 | #156 | Excellent 37.2% |
| Immigrants | Brazil | 76.5 /100 | #157 | Good 37.1% |
| Ute | 75.7 /100 | #158 | Good 37.1% |
| Yaqui | 74.4 /100 | #159 | Good 37.1% |
| Immigrants | Saudi Arabia | 73.9 /100 | #160 | Good 37.0% |
| Cambodians | 71.5 /100 | #161 | Good 37.0% |
Demographics Similar to Sudanese by In Labor Force | Age 16-19
In terms of in labor force | age 16-19, the demographic groups most similar to Sudanese are Ottawa (43.0%, a difference of 0.40%), Slovak (42.6%, a difference of 0.59%), Bangladeshi (42.5%, a difference of 0.92%), Swiss (43.3%, a difference of 0.96%), and German Russian (42.4%, a difference of 1.0%).
| Demographics | Rating | Rank | In Labor Force | Age 16-19 |
| Slovenes | 100.0 /100 | #15 | Exceptional 43.7% |
| Czechs | 100.0 /100 | #16 | Exceptional 43.6% |
| Scandinavians | 100.0 /100 | #17 | Exceptional 43.6% |
| French Canadians | 100.0 /100 | #18 | Exceptional 43.6% |
| Belgians | 100.0 /100 | #19 | Exceptional 43.4% |
| Swiss | 100.0 /100 | #20 | Exceptional 43.3% |
| Ottawa | 100.0 /100 | #21 | Exceptional 43.0% |
| Sudanese | 100.0 /100 | #22 | Exceptional 42.9% |
| Slovaks | 100.0 /100 | #23 | Exceptional 42.6% |
| Bangladeshis | 100.0 /100 | #24 | Exceptional 42.5% |
| German Russians | 100.0 /100 | #25 | Exceptional 42.4% |
| English | 100.0 /100 | #26 | Exceptional 42.4% |
| Welsh | 100.0 /100 | #27 | Exceptional 42.3% |
| Poles | 100.0 /100 | #28 | Exceptional 42.1% |
| French | 100.0 /100 | #29 | Exceptional 42.1% |