Immigrants from Jordan vs Sudanese In Labor Force | Age 16-19
COMPARE
Immigrants from Jordan
Sudanese
In Labor Force | Age 16-19
In Labor Force | Age 16-19 Comparison
Immigrants from Jordan
Sudanese
36.9%
IN LABOR FORCE | AGE 16-19
69.5/ 100
METRIC RATING
162nd/ 347
METRIC RANK
42.9%
IN LABOR FORCE | AGE 16-19
100.0/ 100
METRIC RATING
22nd/ 347
METRIC RANK
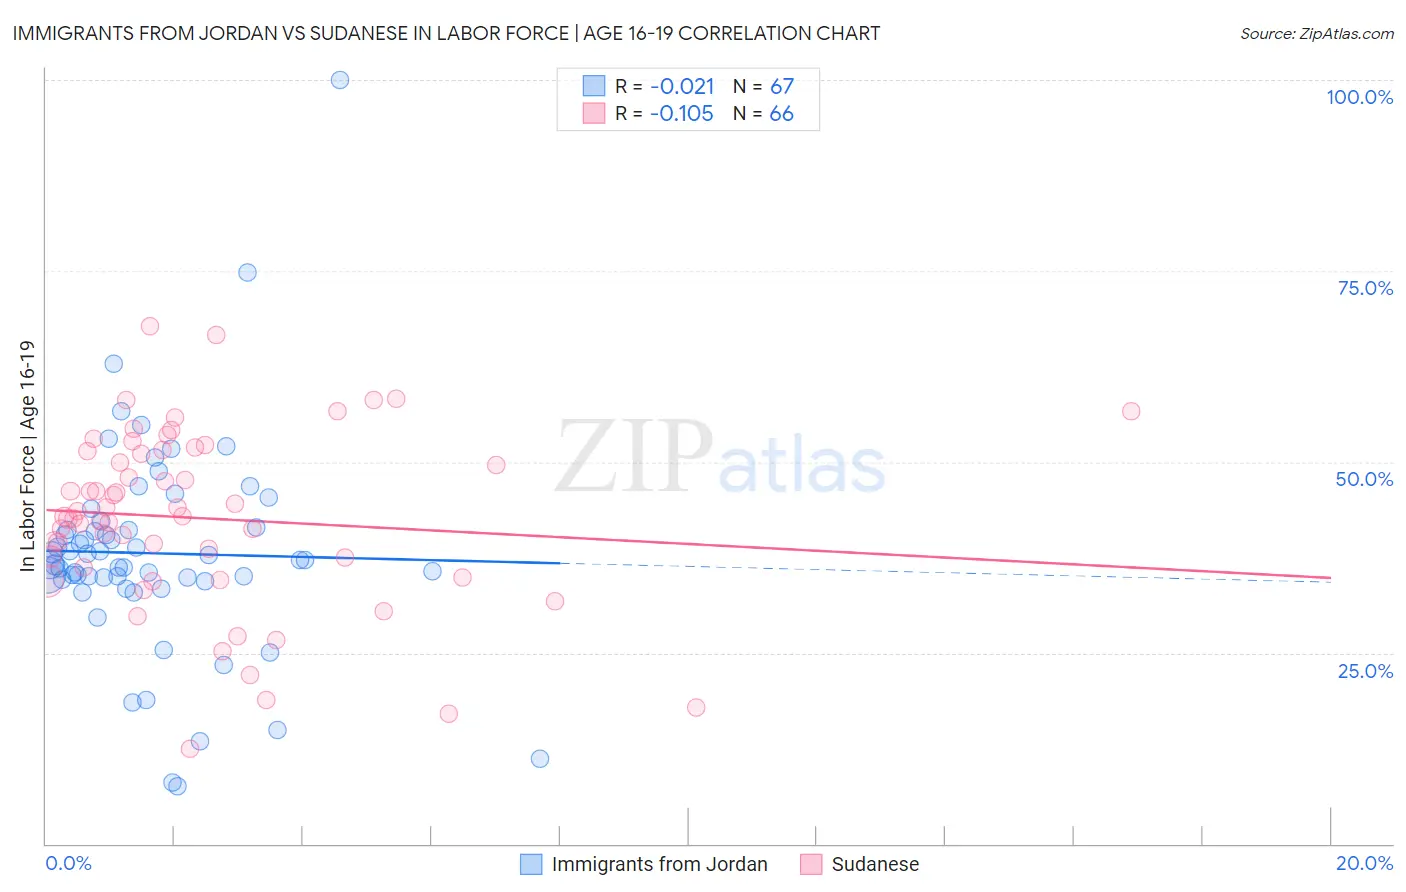
Immigrants from Jordan vs Sudanese In Labor Force | Age 16-19 Correlation Chart
The statistical analysis conducted on geographies consisting of 181,222,099 people shows no correlation between the proportion of Immigrants from Jordan and labor force participation rate among population between the ages 16 and 19 in the United States with a correlation coefficient (R) of -0.021 and weighted average of 36.9%. Similarly, the statistical analysis conducted on geographies consisting of 110,142,178 people shows a poor negative correlation between the proportion of Sudanese and labor force participation rate among population between the ages 16 and 19 in the United States with a correlation coefficient (R) of -0.105 and weighted average of 42.9%, a difference of 16.0%.
In Labor Force | Age 16-19 Correlation Summary
| Measurement | Immigrants from Jordan | Sudanese |
| Minimum | 7.6% | 12.5% |
| Maximum | 100.0% | 67.8% |
| Range | 92.4% | 55.3% |
| Mean | 38.0% | 42.6% |
| Median | 37.2% | 42.8% |
| Interquartile 25% (IQ1) | 34.6% | 36.1% |
| Interquartile 75% (IQ3) | 41.4% | 51.4% |
| Interquartile Range (IQR) | 6.8% | 15.3% |
| Standard Deviation (Sample) | 14.0% | 11.5% |
| Standard Deviation (Population) | 13.9% | 11.4% |
Similar Demographics by In Labor Force | Age 16-19
Demographics Similar to Immigrants from Jordan by In Labor Force | Age 16-19
In terms of in labor force | age 16-19, the demographic groups most similar to Immigrants from Jordan are Bermudan (36.9%, a difference of 0.010%), Immigrants from Kuwait (36.9%, a difference of 0.040%), Cambodian (37.0%, a difference of 0.12%), Yakama (36.9%, a difference of 0.15%), and Immigrants from Western Africa (36.9%, a difference of 0.16%).
| Demographics | Rating | Rank | In Labor Force | Age 16-19 |
| Immigrants | Lithuania | 80.7 /100 | #155 | Excellent 37.2% |
| Kiowa | 80.4 /100 | #156 | Excellent 37.2% |
| Immigrants | Brazil | 76.5 /100 | #157 | Good 37.1% |
| Ute | 75.7 /100 | #158 | Good 37.1% |
| Yaqui | 74.4 /100 | #159 | Good 37.1% |
| Immigrants | Saudi Arabia | 73.9 /100 | #160 | Good 37.0% |
| Cambodians | 71.5 /100 | #161 | Good 37.0% |
| Immigrants | Jordan | 69.5 /100 | #162 | Good 36.9% |
| Bermudans | 69.3 /100 | #163 | Good 36.9% |
| Immigrants | Kuwait | 68.9 /100 | #164 | Good 36.9% |
| Yakama | 66.9 /100 | #165 | Good 36.9% |
| Immigrants | Western Africa | 66.7 /100 | #166 | Good 36.9% |
| Arabs | 63.6 /100 | #167 | Good 36.8% |
| Palestinians | 63.1 /100 | #168 | Good 36.8% |
| Immigrants | Latvia | 61.6 /100 | #169 | Good 36.8% |
Demographics Similar to Sudanese by In Labor Force | Age 16-19
In terms of in labor force | age 16-19, the demographic groups most similar to Sudanese are Ottawa (43.0%, a difference of 0.40%), Slovak (42.6%, a difference of 0.59%), Bangladeshi (42.5%, a difference of 0.92%), Swiss (43.3%, a difference of 0.96%), and German Russian (42.4%, a difference of 1.0%).
| Demographics | Rating | Rank | In Labor Force | Age 16-19 |
| Slovenes | 100.0 /100 | #15 | Exceptional 43.7% |
| Czechs | 100.0 /100 | #16 | Exceptional 43.6% |
| Scandinavians | 100.0 /100 | #17 | Exceptional 43.6% |
| French Canadians | 100.0 /100 | #18 | Exceptional 43.6% |
| Belgians | 100.0 /100 | #19 | Exceptional 43.4% |
| Swiss | 100.0 /100 | #20 | Exceptional 43.3% |
| Ottawa | 100.0 /100 | #21 | Exceptional 43.0% |
| Sudanese | 100.0 /100 | #22 | Exceptional 42.9% |
| Slovaks | 100.0 /100 | #23 | Exceptional 42.6% |
| Bangladeshis | 100.0 /100 | #24 | Exceptional 42.5% |
| German Russians | 100.0 /100 | #25 | Exceptional 42.4% |
| English | 100.0 /100 | #26 | Exceptional 42.4% |
| Welsh | 100.0 /100 | #27 | Exceptional 42.3% |
| Poles | 100.0 /100 | #28 | Exceptional 42.1% |
| French | 100.0 /100 | #29 | Exceptional 42.1% |