Brazilian vs Afghan In Labor Force | Age 16-19
COMPARE
Brazilian
Afghan
In Labor Force | Age 16-19
In Labor Force | Age 16-19 Comparison
Brazilians
Afghans
37.5%
IN LABOR FORCE | AGE 16-19
88.7/ 100
METRIC RATING
147th/ 347
METRIC RANK
36.1%
IN LABOR FORCE | AGE 16-19
25.7/ 100
METRIC RATING
192nd/ 347
METRIC RANK
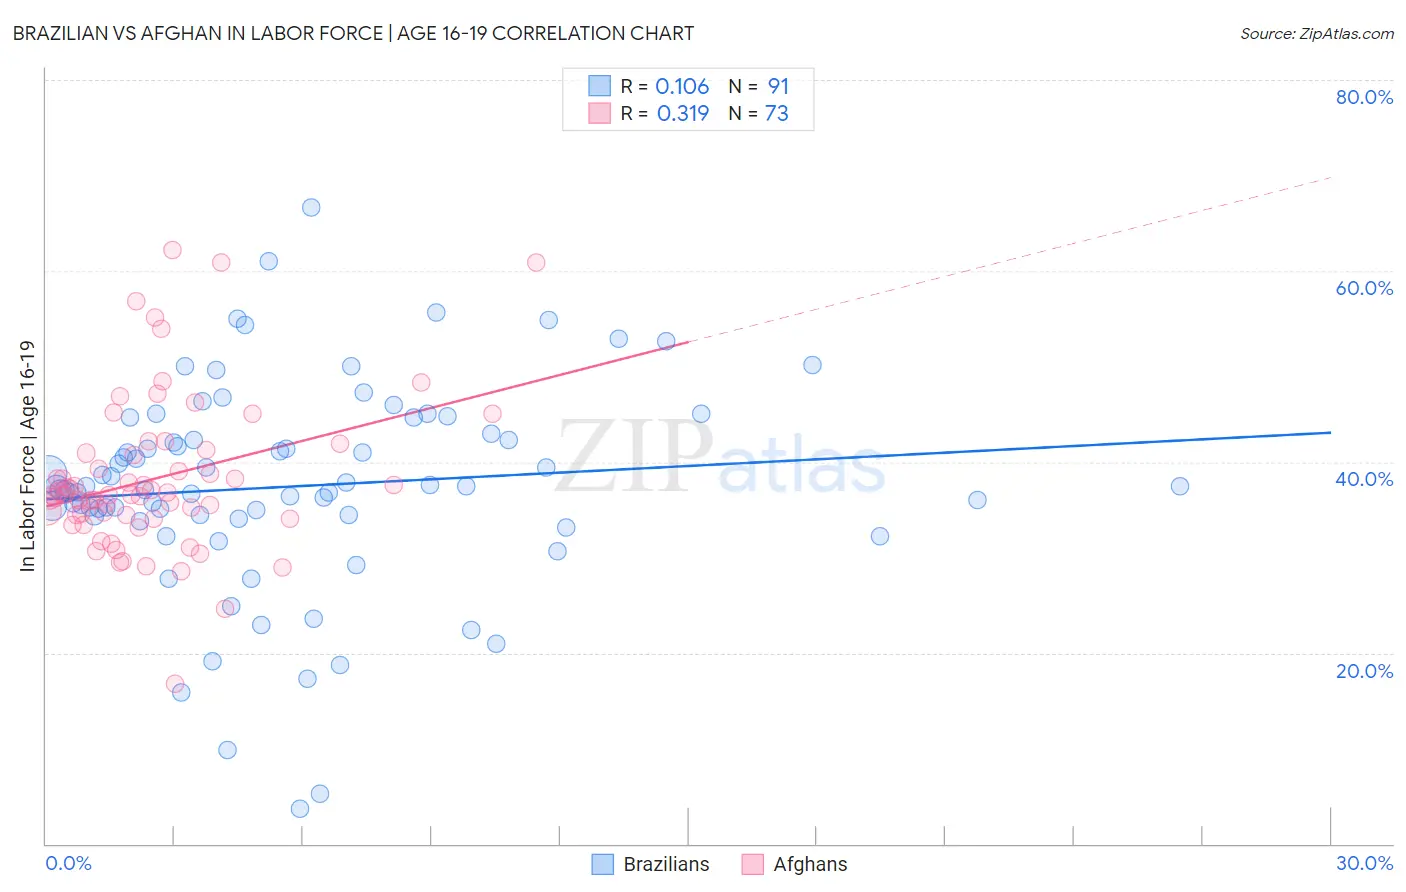
Brazilian vs Afghan In Labor Force | Age 16-19 Correlation Chart
The statistical analysis conducted on geographies consisting of 323,588,239 people shows a poor positive correlation between the proportion of Brazilians and labor force participation rate among population between the ages 16 and 19 in the United States with a correlation coefficient (R) of 0.106 and weighted average of 37.5%. Similarly, the statistical analysis conducted on geographies consisting of 148,830,842 people shows a mild positive correlation between the proportion of Afghans and labor force participation rate among population between the ages 16 and 19 in the United States with a correlation coefficient (R) of 0.319 and weighted average of 36.1%, a difference of 4.0%.
In Labor Force | Age 16-19 Correlation Summary
| Measurement | Brazilian | Afghan |
| Minimum | 3.7% | 16.7% |
| Maximum | 66.7% | 62.2% |
| Range | 63.0% | 45.5% |
| Mean | 37.4% | 38.3% |
| Median | 37.4% | 36.5% |
| Interquartile 25% (IQ1) | 34.3% | 34.2% |
| Interquartile 75% (IQ3) | 43.0% | 41.1% |
| Interquartile Range (IQR) | 8.7% | 6.9% |
| Standard Deviation (Sample) | 10.9% | 8.1% |
| Standard Deviation (Population) | 10.8% | 8.1% |
Similar Demographics by In Labor Force | Age 16-19
Demographics Similar to Brazilians by In Labor Force | Age 16-19
In terms of in labor force | age 16-19, the demographic groups most similar to Brazilians are Immigrants from Western Europe (37.5%, a difference of 0.030%), Japanese (37.5%, a difference of 0.080%), Paiute (37.5%, a difference of 0.080%), Pakistani (37.6%, a difference of 0.10%), and Sierra Leonean (37.6%, a difference of 0.13%).
| Demographics | Rating | Rank | In Labor Force | Age 16-19 |
| Estonians | 91.7 /100 | #140 | Exceptional 37.7% |
| Syrians | 90.7 /100 | #141 | Exceptional 37.6% |
| Sierra Leoneans | 89.7 /100 | #142 | Excellent 37.6% |
| Pakistanis | 89.5 /100 | #143 | Excellent 37.6% |
| Japanese | 89.3 /100 | #144 | Excellent 37.5% |
| Paiute | 89.3 /100 | #145 | Excellent 37.5% |
| Immigrants | Western Europe | 88.9 /100 | #146 | Excellent 37.5% |
| Brazilians | 88.7 /100 | #147 | Excellent 37.5% |
| Romanians | 87.3 /100 | #148 | Excellent 37.5% |
| Native Hawaiians | 85.0 /100 | #149 | Excellent 37.4% |
| Tsimshian | 84.7 /100 | #150 | Excellent 37.4% |
| Immigrants | Poland | 84.4 /100 | #151 | Excellent 37.3% |
| Immigrants | Sierra Leone | 83.6 /100 | #152 | Excellent 37.3% |
| Arapaho | 81.8 /100 | #153 | Excellent 37.3% |
| Immigrants | Bulgaria | 81.6 /100 | #154 | Excellent 37.3% |
Demographics Similar to Afghans by In Labor Force | Age 16-19
In terms of in labor force | age 16-19, the demographic groups most similar to Afghans are Immigrants from Denmark (36.1%, a difference of 0.040%), Nigerian (36.1%, a difference of 0.070%), Immigrants from Croatia (36.1%, a difference of 0.12%), Bolivian (36.0%, a difference of 0.16%), and Panamanian (36.1%, a difference of 0.19%).
| Demographics | Rating | Rank | In Labor Force | Age 16-19 |
| Bhutanese | 35.3 /100 | #185 | Fair 36.3% |
| Immigrants | Romania | 34.0 /100 | #186 | Fair 36.3% |
| Immigrants | Afghanistan | 34.0 /100 | #187 | Fair 36.3% |
| Immigrants | Europe | 31.8 /100 | #188 | Fair 36.2% |
| Immigrants | Hungary | 28.8 /100 | #189 | Fair 36.2% |
| Panamanians | 28.6 /100 | #190 | Fair 36.1% |
| Immigrants | Croatia | 27.5 /100 | #191 | Fair 36.1% |
| Afghans | 25.7 /100 | #192 | Fair 36.1% |
| Immigrants | Denmark | 25.0 /100 | #193 | Fair 36.1% |
| Nigerians | 24.6 /100 | #194 | Fair 36.1% |
| Bolivians | 23.3 /100 | #195 | Fair 36.0% |
| Mexican American Indians | 21.1 /100 | #196 | Fair 36.0% |
| Immigrants | Serbia | 21.0 /100 | #197 | Fair 36.0% |
| Immigrants | Northern Africa | 19.9 /100 | #198 | Poor 35.9% |
| Immigrants | Norway | 19.8 /100 | #199 | Poor 35.9% |