Cherokee vs Afghan In Labor Force | Age 16-19
COMPARE
Cherokee
Afghan
In Labor Force | Age 16-19
In Labor Force | Age 16-19 Comparison
Cherokee
Afghans
40.2%
IN LABOR FORCE | AGE 16-19
100.0/ 100
METRIC RATING
62nd/ 347
METRIC RANK
36.1%
IN LABOR FORCE | AGE 16-19
25.7/ 100
METRIC RATING
192nd/ 347
METRIC RANK
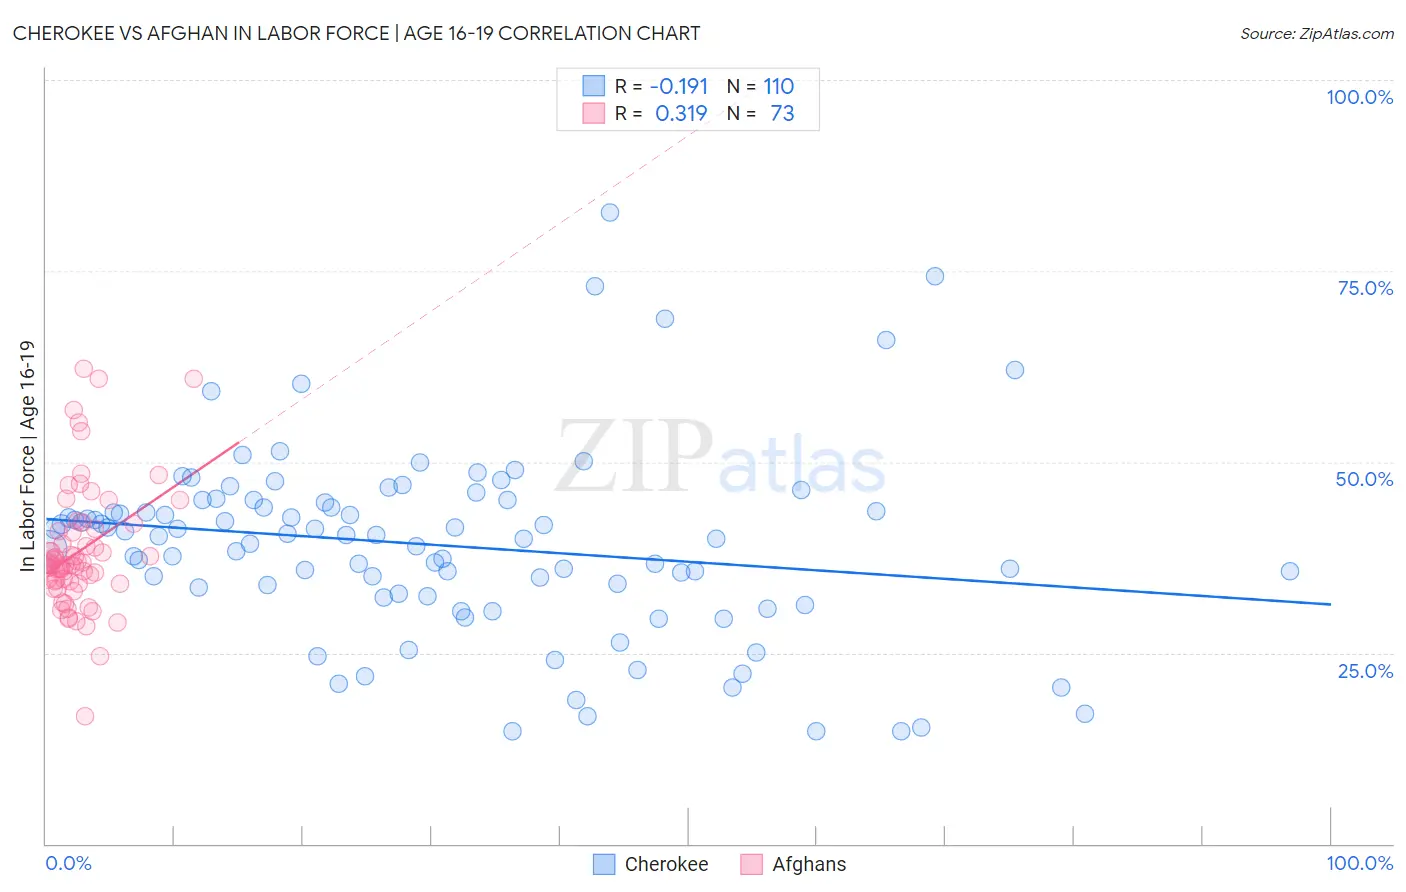
Cherokee vs Afghan In Labor Force | Age 16-19 Correlation Chart
The statistical analysis conducted on geographies consisting of 492,065,053 people shows a poor negative correlation between the proportion of Cherokee and labor force participation rate among population between the ages 16 and 19 in the United States with a correlation coefficient (R) of -0.191 and weighted average of 40.2%. Similarly, the statistical analysis conducted on geographies consisting of 148,830,842 people shows a mild positive correlation between the proportion of Afghans and labor force participation rate among population between the ages 16 and 19 in the United States with a correlation coefficient (R) of 0.319 and weighted average of 36.1%, a difference of 11.5%.
In Labor Force | Age 16-19 Correlation Summary
| Measurement | Cherokee | Afghan |
| Minimum | 14.7% | 16.7% |
| Maximum | 82.7% | 62.2% |
| Range | 68.0% | 45.5% |
| Mean | 39.1% | 38.3% |
| Median | 40.3% | 36.5% |
| Interquartile 25% (IQ1) | 32.8% | 34.2% |
| Interquartile 75% (IQ3) | 44.6% | 41.1% |
| Interquartile Range (IQR) | 11.9% | 6.9% |
| Standard Deviation (Sample) | 12.3% | 8.1% |
| Standard Deviation (Population) | 12.3% | 8.1% |
Similar Demographics by In Labor Force | Age 16-19
Demographics Similar to Cherokee by In Labor Force | Age 16-19
In terms of in labor force | age 16-19, the demographic groups most similar to Cherokee are Northern European (40.2%, a difference of 0.060%), American (40.3%, a difference of 0.14%), Immigrants from Micronesia (40.2%, a difference of 0.17%), Kenyan (40.1%, a difference of 0.25%), and Immigrants from Eastern Africa (40.4%, a difference of 0.29%).
| Demographics | Rating | Rank | In Labor Force | Age 16-19 |
| British | 100.0 /100 | #55 | Exceptional 40.5% |
| Fijians | 100.0 /100 | #56 | Exceptional 40.4% |
| Lithuanians | 100.0 /100 | #57 | Exceptional 40.4% |
| Aleuts | 100.0 /100 | #58 | Exceptional 40.4% |
| Slavs | 100.0 /100 | #59 | Exceptional 40.4% |
| Immigrants | Eastern Africa | 100.0 /100 | #60 | Exceptional 40.4% |
| Americans | 100.0 /100 | #61 | Exceptional 40.3% |
| Cherokee | 100.0 /100 | #62 | Exceptional 40.2% |
| Northern Europeans | 100.0 /100 | #63 | Exceptional 40.2% |
| Immigrants | Micronesia | 100.0 /100 | #64 | Exceptional 40.2% |
| Kenyans | 100.0 /100 | #65 | Exceptional 40.1% |
| Immigrants | Nonimmigrants | 100.0 /100 | #66 | Exceptional 40.1% |
| Canadians | 100.0 /100 | #67 | Exceptional 40.1% |
| Italians | 99.9 /100 | #68 | Exceptional 40.1% |
| Potawatomi | 99.9 /100 | #69 | Exceptional 40.0% |
Demographics Similar to Afghans by In Labor Force | Age 16-19
In terms of in labor force | age 16-19, the demographic groups most similar to Afghans are Immigrants from Denmark (36.1%, a difference of 0.040%), Nigerian (36.1%, a difference of 0.070%), Immigrants from Croatia (36.1%, a difference of 0.12%), Bolivian (36.0%, a difference of 0.16%), and Panamanian (36.1%, a difference of 0.19%).
| Demographics | Rating | Rank | In Labor Force | Age 16-19 |
| Bhutanese | 35.3 /100 | #185 | Fair 36.3% |
| Immigrants | Romania | 34.0 /100 | #186 | Fair 36.3% |
| Immigrants | Afghanistan | 34.0 /100 | #187 | Fair 36.3% |
| Immigrants | Europe | 31.8 /100 | #188 | Fair 36.2% |
| Immigrants | Hungary | 28.8 /100 | #189 | Fair 36.2% |
| Panamanians | 28.6 /100 | #190 | Fair 36.1% |
| Immigrants | Croatia | 27.5 /100 | #191 | Fair 36.1% |
| Afghans | 25.7 /100 | #192 | Fair 36.1% |
| Immigrants | Denmark | 25.0 /100 | #193 | Fair 36.1% |
| Nigerians | 24.6 /100 | #194 | Fair 36.1% |
| Bolivians | 23.3 /100 | #195 | Fair 36.0% |
| Mexican American Indians | 21.1 /100 | #196 | Fair 36.0% |
| Immigrants | Serbia | 21.0 /100 | #197 | Fair 36.0% |
| Immigrants | Northern Africa | 19.9 /100 | #198 | Poor 35.9% |
| Immigrants | Norway | 19.8 /100 | #199 | Poor 35.9% |