Immigrants from England vs Afghan Median Household Income
COMPARE
Immigrants from England
Afghan
Median Household Income
Median Household Income Comparison
Immigrants from England
Afghans
$92,098
MEDIAN HOUSEHOLD INCOME
98.9/ 100
METRIC RATING
86th/ 347
METRIC RANK
$97,026
MEDIAN HOUSEHOLD INCOME
100.0/ 100
METRIC RATING
39th/ 347
METRIC RANK
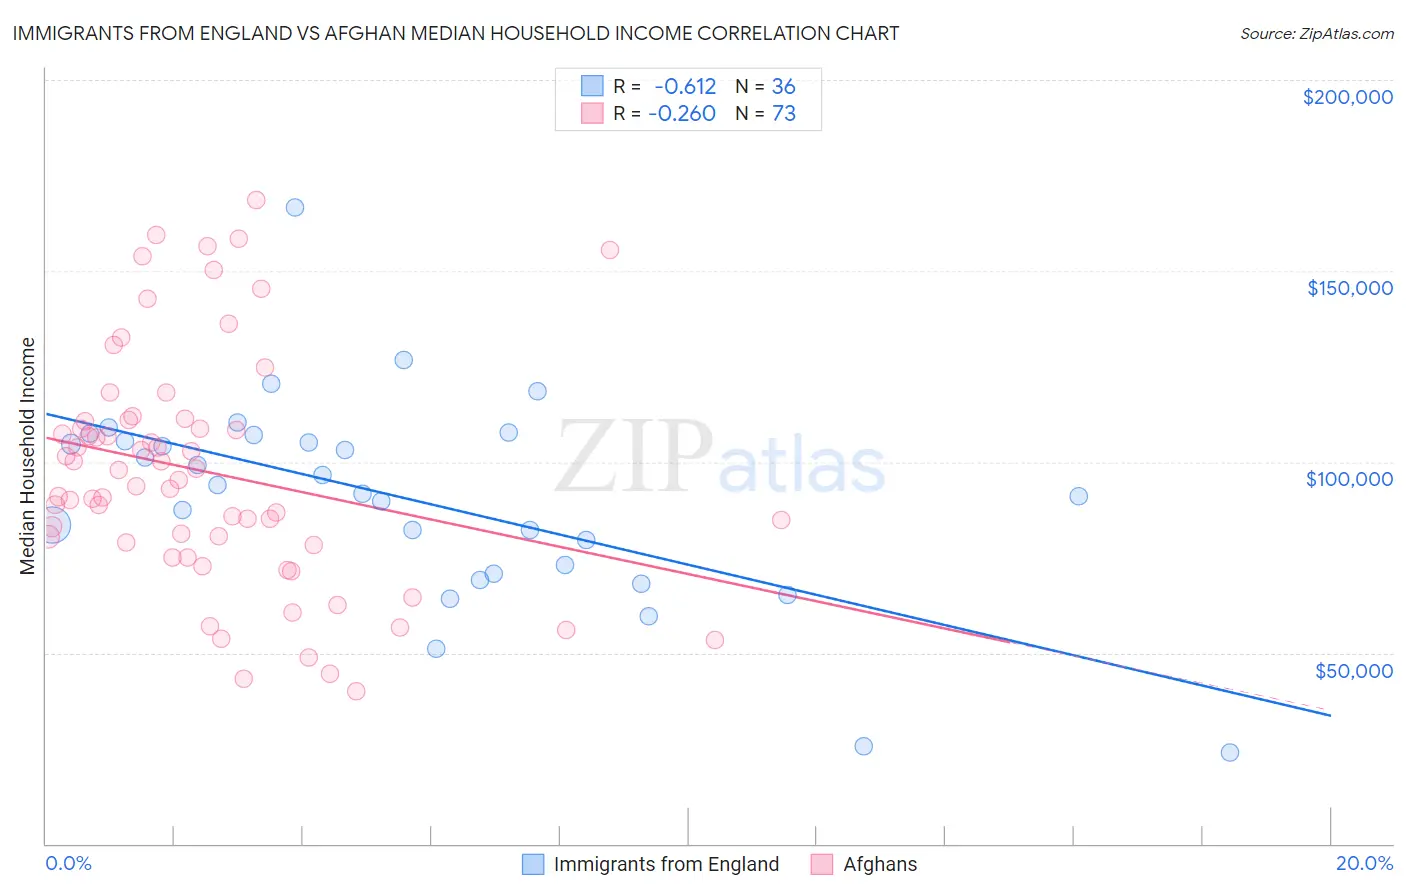
Immigrants from England vs Afghan Median Household Income Correlation Chart
The statistical analysis conducted on geographies consisting of 391,695,361 people shows a significant negative correlation between the proportion of Immigrants from England and median household income in the United States with a correlation coefficient (R) of -0.612 and weighted average of $92,098. Similarly, the statistical analysis conducted on geographies consisting of 148,820,759 people shows a weak negative correlation between the proportion of Afghans and median household income in the United States with a correlation coefficient (R) of -0.260 and weighted average of $97,026, a difference of 5.3%.
Median Household Income Correlation Summary
| Measurement | Immigrants from England | Afghan |
| Minimum | $24,028 | $40,069 |
| Maximum | $166,753 | $168,646 |
| Range | $142,725 | $128,577 |
| Mean | $90,135 | $97,284 |
| Median | $92,873 | $95,399 |
| Interquartile 25% (IQ1) | $71,885 | $78,550 |
| Interquartile 75% (IQ3) | $106,085 | $110,861 |
| Interquartile Range (IQR) | $34,200 | $32,311 |
| Standard Deviation (Sample) | $27,284 | $30,429 |
| Standard Deviation (Population) | $26,903 | $30,220 |
Similar Demographics by Median Household Income
Demographics Similar to Immigrants from England by Median Household Income
In terms of median household income, the demographic groups most similar to Immigrants from England are Immigrants from Hungary ($92,094, a difference of 0.0%), Immigrants from Canada ($92,029, a difference of 0.080%), Romanian ($91,994, a difference of 0.11%), Assyrian/Chaldean/Syriac ($91,991, a difference of 0.12%), and Immigrants from Vietnam ($91,987, a difference of 0.12%).
| Demographics | Rating | Rank | Median Household Income |
| Sri Lankans | 99.4 /100 | #79 | Exceptional $93,093 |
| Tongans | 99.4 /100 | #80 | Exceptional $93,076 |
| Immigrants | Eastern Europe | 99.4 /100 | #81 | Exceptional $93,051 |
| Immigrants | Spain | 99.3 /100 | #82 | Exceptional $92,732 |
| Italians | 99.1 /100 | #83 | Exceptional $92,475 |
| Immigrants | Argentina | 99.1 /100 | #84 | Exceptional $92,417 |
| Immigrants | Croatia | 99.0 /100 | #85 | Exceptional $92,225 |
| Immigrants | England | 98.9 /100 | #86 | Exceptional $92,098 |
| Immigrants | Hungary | 98.9 /100 | #87 | Exceptional $92,094 |
| Immigrants | Canada | 98.8 /100 | #88 | Exceptional $92,029 |
| Romanians | 98.8 /100 | #89 | Exceptional $91,994 |
| Assyrians/Chaldeans/Syriacs | 98.8 /100 | #90 | Exceptional $91,991 |
| Immigrants | Vietnam | 98.8 /100 | #91 | Exceptional $91,987 |
| Immigrants | Western Europe | 98.8 /100 | #92 | Exceptional $91,936 |
| Immigrants | Lebanon | 98.7 /100 | #93 | Exceptional $91,887 |
Demographics Similar to Afghans by Median Household Income
In terms of median household income, the demographic groups most similar to Afghans are Maltese ($97,015, a difference of 0.010%), Immigrants from Turkey ($96,964, a difference of 0.060%), Immigrants from Lithuania ($96,836, a difference of 0.20%), Immigrants from Indonesia ($97,297, a difference of 0.28%), and Latvian ($97,311, a difference of 0.29%).
| Demographics | Rating | Rank | Median Household Income |
| Immigrants | Denmark | 100.0 /100 | #32 | Exceptional $98,510 |
| Chinese | 100.0 /100 | #33 | Exceptional $98,496 |
| Russians | 100.0 /100 | #34 | Exceptional $98,008 |
| Immigrants | Switzerland | 100.0 /100 | #35 | Exceptional $97,979 |
| Immigrants | Pakistan | 100.0 /100 | #36 | Exceptional $97,528 |
| Latvians | 100.0 /100 | #37 | Exceptional $97,311 |
| Immigrants | Indonesia | 100.0 /100 | #38 | Exceptional $97,297 |
| Afghans | 100.0 /100 | #39 | Exceptional $97,026 |
| Maltese | 100.0 /100 | #40 | Exceptional $97,015 |
| Immigrants | Turkey | 100.0 /100 | #41 | Exceptional $96,964 |
| Immigrants | Lithuania | 99.9 /100 | #42 | Exceptional $96,836 |
| Immigrants | France | 99.9 /100 | #43 | Exceptional $96,743 |
| Immigrants | Greece | 99.9 /100 | #44 | Exceptional $96,675 |
| Israelis | 99.9 /100 | #45 | Exceptional $96,552 |
| Australians | 99.9 /100 | #46 | Exceptional $96,490 |