Immigrants from Switzerland vs American In Labor Force | Age 25-29
COMPARE
Immigrants from Switzerland
American
In Labor Force | Age 25-29
In Labor Force | Age 25-29 Comparison
Immigrants from Switzerland
Americans
85.1%
IN LABOR FORCE | AGE 25-29
93.9/ 100
METRIC RATING
100th/ 347
METRIC RANK
83.1%
IN LABOR FORCE | AGE 25-29
0.0/ 100
METRIC RATING
282nd/ 347
METRIC RANK
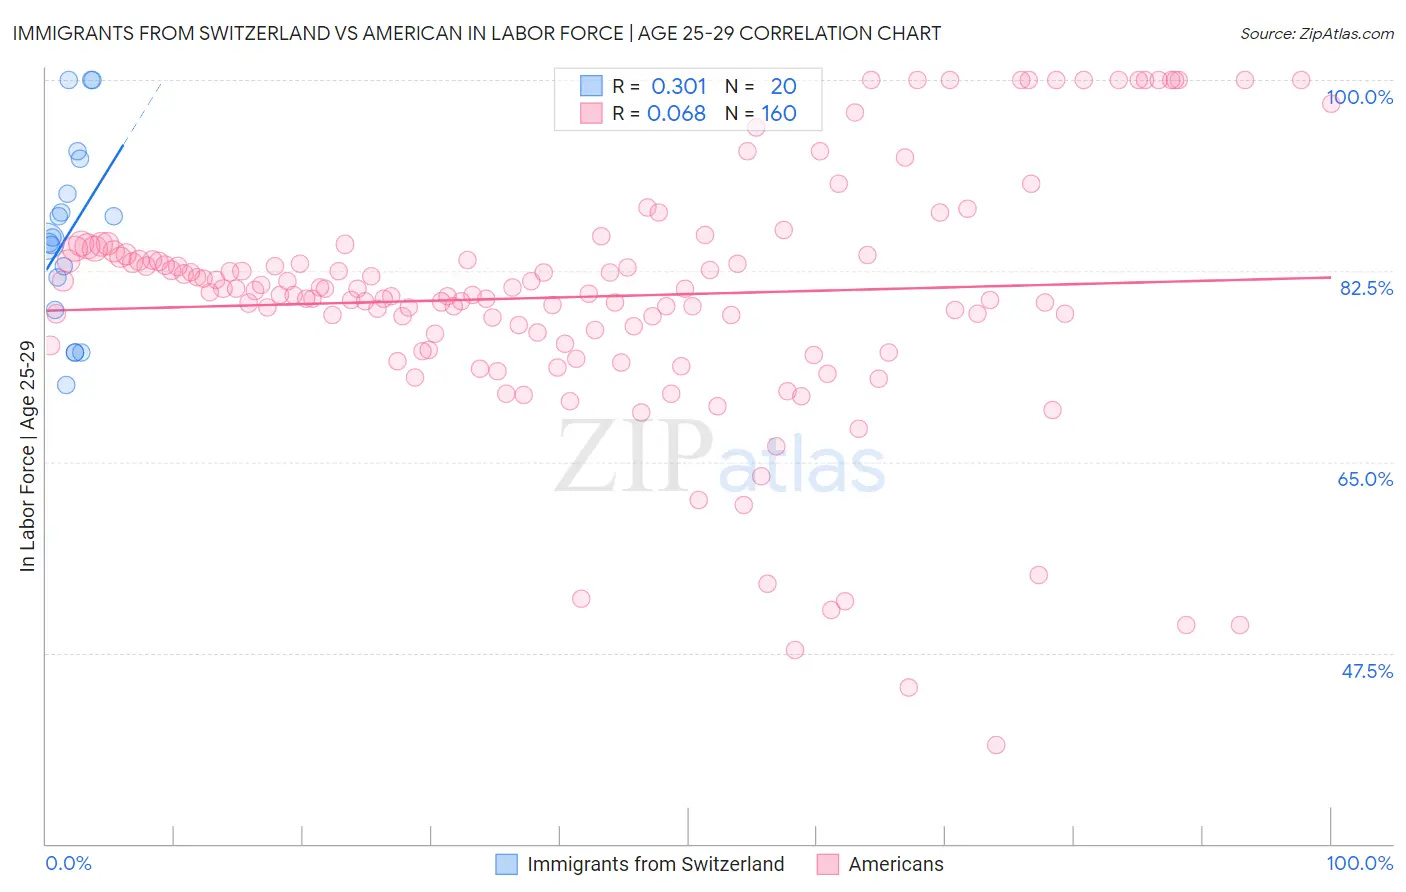
Immigrants from Switzerland vs American In Labor Force | Age 25-29 Correlation Chart
The statistical analysis conducted on geographies consisting of 148,053,964 people shows a mild positive correlation between the proportion of Immigrants from Switzerland and labor force participation rate among population between the ages 25 and 29 in the United States with a correlation coefficient (R) of 0.301 and weighted average of 85.1%. Similarly, the statistical analysis conducted on geographies consisting of 580,038,437 people shows a slight positive correlation between the proportion of Americans and labor force participation rate among population between the ages 25 and 29 in the United States with a correlation coefficient (R) of 0.068 and weighted average of 83.1%, a difference of 2.4%.
In Labor Force | Age 25-29 Correlation Summary
| Measurement | Immigrants from Switzerland | American |
| Minimum | 72.1% | 39.0% |
| Maximum | 100.0% | 100.0% |
| Range | 27.9% | 61.0% |
| Mean | 86.0% | 80.1% |
| Median | 85.4% | 80.6% |
| Interquartile 25% (IQ1) | 80.4% | 76.3% |
| Interquartile 75% (IQ3) | 91.2% | 84.0% |
| Interquartile Range (IQR) | 10.8% | 7.7% |
| Standard Deviation (Sample) | 8.4% | 11.5% |
| Standard Deviation (Population) | 8.2% | 11.5% |
Similar Demographics by In Labor Force | Age 25-29
Demographics Similar to Immigrants from Switzerland by In Labor Force | Age 25-29
In terms of in labor force | age 25-29, the demographic groups most similar to Immigrants from Switzerland are Bangladeshi (85.1%, a difference of 0.0%), Egyptian (85.1%, a difference of 0.0%), Immigrants from Sudan (85.1%, a difference of 0.010%), Mongolian (85.1%, a difference of 0.010%), and Slavic (85.1%, a difference of 0.010%).
| Demographics | Rating | Rank | In Labor Force | Age 25-29 |
| Austrians | 95.3 /100 | #93 | Exceptional 85.1% |
| Immigrants | Korea | 94.8 /100 | #94 | Exceptional 85.1% |
| Immigrants | Netherlands | 94.6 /100 | #95 | Exceptional 85.1% |
| Immigrants | Romania | 94.6 /100 | #96 | Exceptional 85.1% |
| Immigrants | Sudan | 94.3 /100 | #97 | Exceptional 85.1% |
| Mongolians | 94.1 /100 | #98 | Exceptional 85.1% |
| Bangladeshis | 94.0 /100 | #99 | Exceptional 85.1% |
| Immigrants | Switzerland | 93.9 /100 | #100 | Exceptional 85.1% |
| Egyptians | 93.8 /100 | #101 | Exceptional 85.1% |
| Slavs | 93.7 /100 | #102 | Exceptional 85.1% |
| Immigrants | Japan | 93.5 /100 | #103 | Exceptional 85.1% |
| Immigrants | Zaire | 93.3 /100 | #104 | Exceptional 85.1% |
| Immigrants | Hong Kong | 92.8 /100 | #105 | Exceptional 85.0% |
| Czechoslovakians | 92.6 /100 | #106 | Exceptional 85.0% |
| Immigrants | Southern Europe | 92.3 /100 | #107 | Exceptional 85.0% |
Demographics Similar to Americans by In Labor Force | Age 25-29
In terms of in labor force | age 25-29, the demographic groups most similar to Americans are Immigrants from the Azores (83.1%, a difference of 0.0%), Immigrants from Dominican Republic (83.1%, a difference of 0.010%), Nicaraguan (83.1%, a difference of 0.020%), Belizean (83.1%, a difference of 0.060%), and Dominican (83.2%, a difference of 0.070%).
| Demographics | Rating | Rank | In Labor Force | Age 25-29 |
| Samoans | 0.0 /100 | #275 | Tragic 83.3% |
| Immigrants | Honduras | 0.0 /100 | #276 | Tragic 83.3% |
| Africans | 0.0 /100 | #277 | Tragic 83.2% |
| Immigrants | Cuba | 0.0 /100 | #278 | Tragic 83.2% |
| British West Indians | 0.0 /100 | #279 | Tragic 83.2% |
| Dominicans | 0.0 /100 | #280 | Tragic 83.2% |
| Immigrants | Dominican Republic | 0.0 /100 | #281 | Tragic 83.1% |
| Americans | 0.0 /100 | #282 | Tragic 83.1% |
| Immigrants | Azores | 0.0 /100 | #283 | Tragic 83.1% |
| Nicaraguans | 0.0 /100 | #284 | Tragic 83.1% |
| Belizeans | 0.0 /100 | #285 | Tragic 83.1% |
| Mexican American Indians | 0.0 /100 | #286 | Tragic 83.0% |
| Guyanese | 0.0 /100 | #287 | Tragic 83.0% |
| Ottawa | 0.0 /100 | #288 | Tragic 83.0% |
| Immigrants | Micronesia | 0.0 /100 | #289 | Tragic 83.0% |