Peruvian vs American In Labor Force | Age 25-29
COMPARE
Peruvian
American
In Labor Force | Age 25-29
In Labor Force | Age 25-29 Comparison
Peruvians
Americans
84.7%
IN LABOR FORCE | AGE 25-29
64.7/ 100
METRIC RATING
149th/ 347
METRIC RANK
83.1%
IN LABOR FORCE | AGE 25-29
0.0/ 100
METRIC RATING
282nd/ 347
METRIC RANK
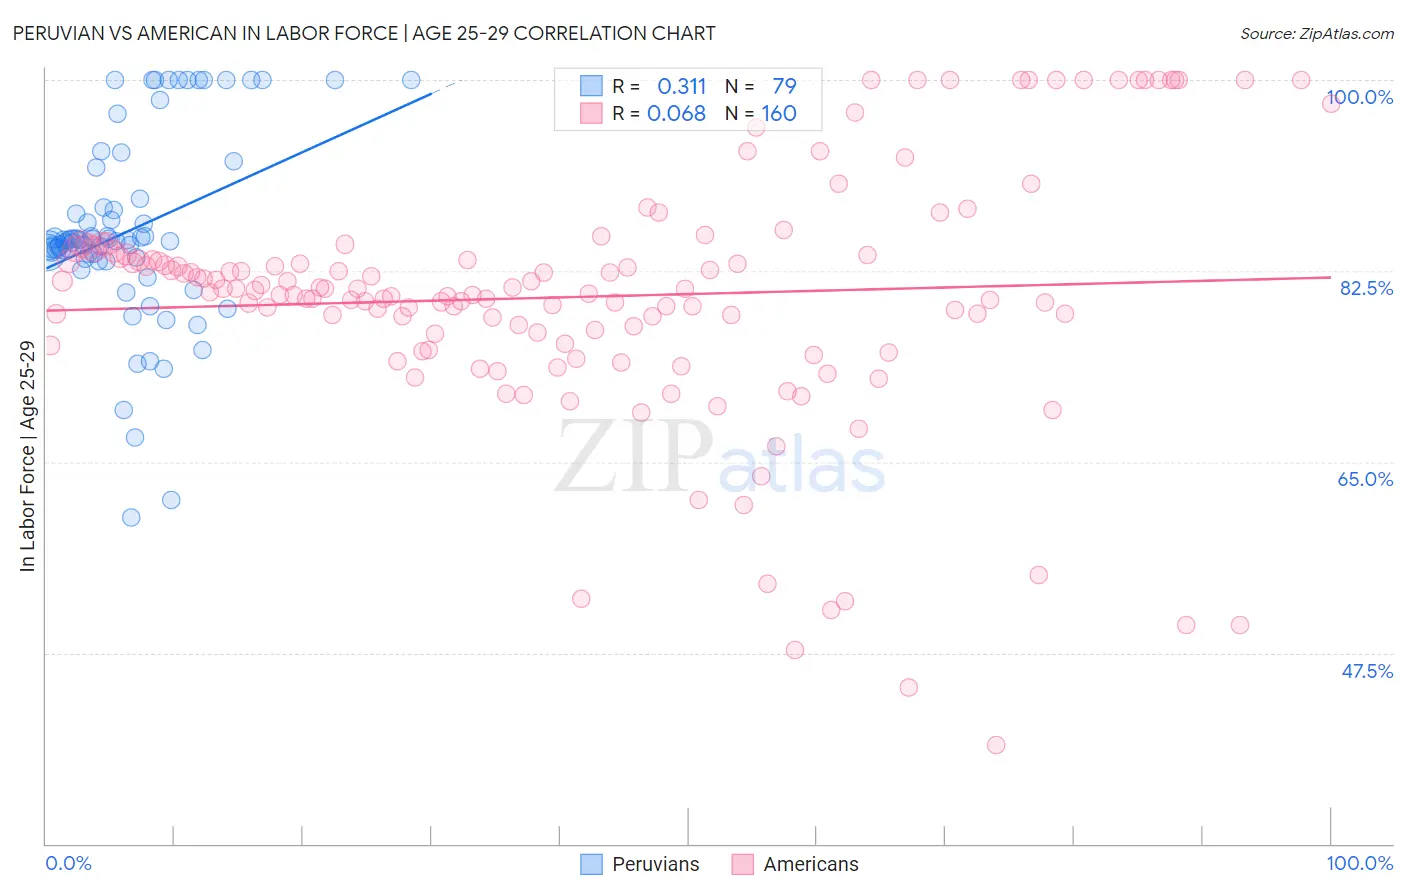
Peruvian vs American In Labor Force | Age 25-29 Correlation Chart
The statistical analysis conducted on geographies consisting of 363,155,715 people shows a mild positive correlation between the proportion of Peruvians and labor force participation rate among population between the ages 25 and 29 in the United States with a correlation coefficient (R) of 0.311 and weighted average of 84.7%. Similarly, the statistical analysis conducted on geographies consisting of 580,038,437 people shows a slight positive correlation between the proportion of Americans and labor force participation rate among population between the ages 25 and 29 in the United States with a correlation coefficient (R) of 0.068 and weighted average of 83.1%, a difference of 2.0%.
In Labor Force | Age 25-29 Correlation Summary
| Measurement | Peruvian | American |
| Minimum | 59.9% | 39.0% |
| Maximum | 100.0% | 100.0% |
| Range | 40.1% | 61.0% |
| Mean | 86.2% | 80.1% |
| Median | 85.3% | 80.6% |
| Interquartile 25% (IQ1) | 83.7% | 76.3% |
| Interquartile 75% (IQ3) | 89.1% | 84.0% |
| Interquartile Range (IQR) | 5.4% | 7.7% |
| Standard Deviation (Sample) | 8.7% | 11.5% |
| Standard Deviation (Population) | 8.6% | 11.5% |
Similar Demographics by In Labor Force | Age 25-29
Demographics Similar to Peruvians by In Labor Force | Age 25-29
In terms of in labor force | age 25-29, the demographic groups most similar to Peruvians are Immigrants from England (84.7%, a difference of 0.0%), Swiss (84.7%, a difference of 0.0%), Colombian (84.7%, a difference of 0.010%), Immigrants from Pakistan (84.7%, a difference of 0.020%), and Immigrants from Taiwan (84.7%, a difference of 0.020%).
| Demographics | Rating | Rank | In Labor Force | Age 25-29 |
| Pakistanis | 70.0 /100 | #142 | Good 84.8% |
| Sri Lankans | 69.2 /100 | #143 | Good 84.8% |
| Immigrants | Laos | 69.0 /100 | #144 | Good 84.8% |
| Immigrants | Senegal | 68.3 /100 | #145 | Good 84.8% |
| Icelanders | 68.2 /100 | #146 | Good 84.8% |
| Immigrants | Asia | 68.2 /100 | #147 | Good 84.8% |
| Immigrants | England | 65.2 /100 | #148 | Good 84.7% |
| Peruvians | 64.7 /100 | #149 | Good 84.7% |
| Swiss | 64.7 /100 | #150 | Good 84.7% |
| Colombians | 62.8 /100 | #151 | Good 84.7% |
| Immigrants | Pakistan | 62.7 /100 | #152 | Good 84.7% |
| Immigrants | Taiwan | 62.2 /100 | #153 | Good 84.7% |
| Immigrants | Sri Lanka | 61.7 /100 | #154 | Good 84.7% |
| Indians (Asian) | 61.6 /100 | #155 | Good 84.7% |
| French | 61.0 /100 | #156 | Good 84.7% |
Demographics Similar to Americans by In Labor Force | Age 25-29
In terms of in labor force | age 25-29, the demographic groups most similar to Americans are Immigrants from the Azores (83.1%, a difference of 0.0%), Immigrants from Dominican Republic (83.1%, a difference of 0.010%), Nicaraguan (83.1%, a difference of 0.020%), Belizean (83.1%, a difference of 0.060%), and Dominican (83.2%, a difference of 0.070%).
| Demographics | Rating | Rank | In Labor Force | Age 25-29 |
| Samoans | 0.0 /100 | #275 | Tragic 83.3% |
| Immigrants | Honduras | 0.0 /100 | #276 | Tragic 83.3% |
| Africans | 0.0 /100 | #277 | Tragic 83.2% |
| Immigrants | Cuba | 0.0 /100 | #278 | Tragic 83.2% |
| British West Indians | 0.0 /100 | #279 | Tragic 83.2% |
| Dominicans | 0.0 /100 | #280 | Tragic 83.2% |
| Immigrants | Dominican Republic | 0.0 /100 | #281 | Tragic 83.1% |
| Americans | 0.0 /100 | #282 | Tragic 83.1% |
| Immigrants | Azores | 0.0 /100 | #283 | Tragic 83.1% |
| Nicaraguans | 0.0 /100 | #284 | Tragic 83.1% |
| Belizeans | 0.0 /100 | #285 | Tragic 83.1% |
| Mexican American Indians | 0.0 /100 | #286 | Tragic 83.0% |
| Guyanese | 0.0 /100 | #287 | Tragic 83.0% |
| Ottawa | 0.0 /100 | #288 | Tragic 83.0% |
| Immigrants | Micronesia | 0.0 /100 | #289 | Tragic 83.0% |