Immigrants from Nepal vs Native/Alaskan In Labor Force | Age 35-44
COMPARE
Immigrants from Nepal
Native/Alaskan
In Labor Force | Age 35-44
In Labor Force | Age 35-44 Comparison
Immigrants from Nepal
Natives/Alaskans
85.3%
IN LABOR FORCE | AGE 35-44
99.9/ 100
METRIC RATING
34th/ 347
METRIC RANK
78.9%
IN LABOR FORCE | AGE 35-44
0.0/ 100
METRIC RATING
335th/ 347
METRIC RANK
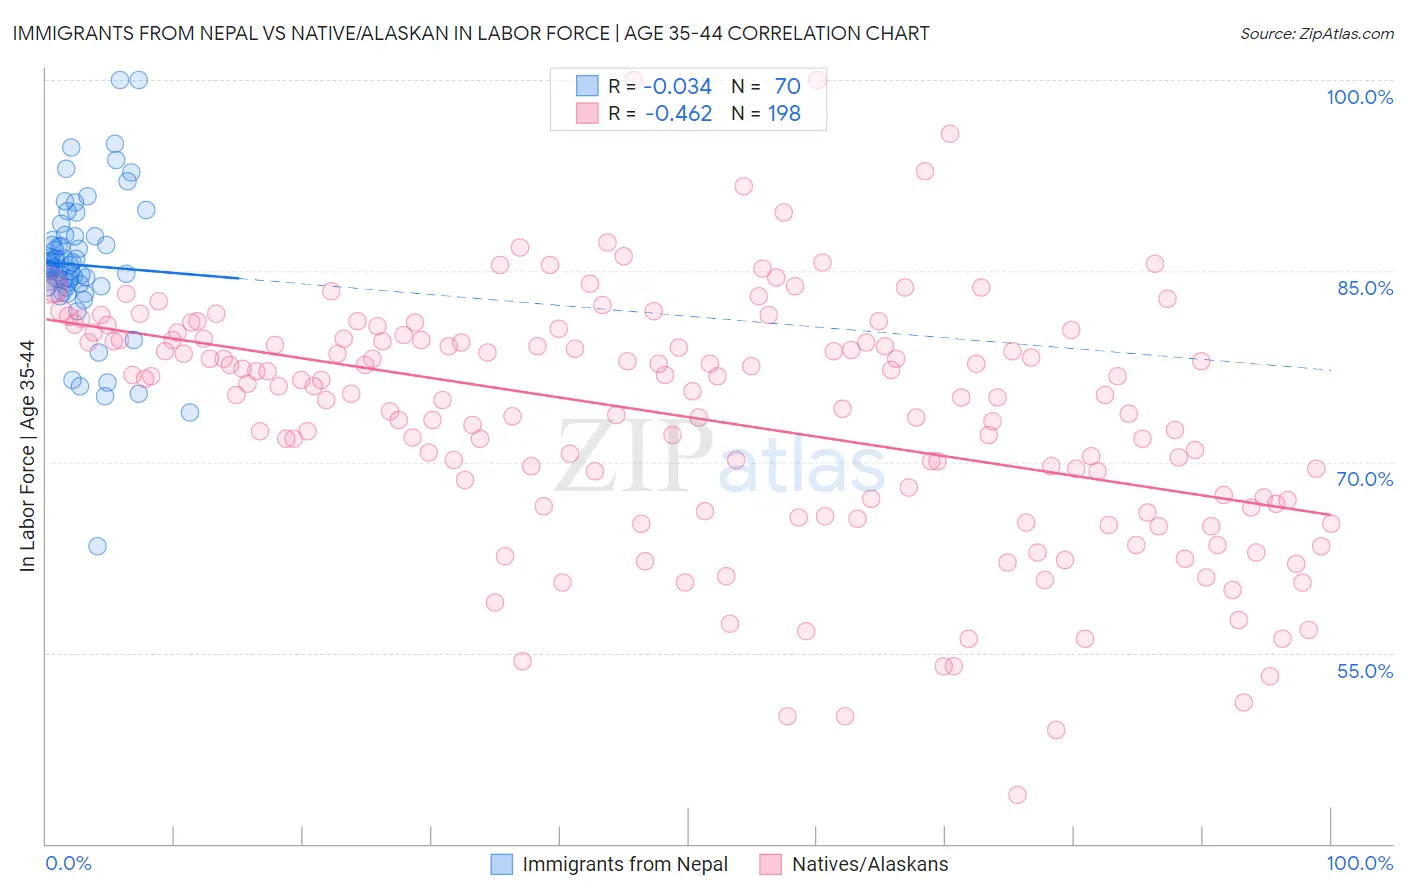
Immigrants from Nepal vs Native/Alaskan In Labor Force | Age 35-44 Correlation Chart
The statistical analysis conducted on geographies consisting of 186,726,251 people shows no correlation between the proportion of Immigrants from Nepal and labor force participation rate among population between the ages 35 and 44 in the United States with a correlation coefficient (R) of -0.034 and weighted average of 85.3%. Similarly, the statistical analysis conducted on geographies consisting of 512,690,286 people shows a moderate negative correlation between the proportion of Natives/Alaskans and labor force participation rate among population between the ages 35 and 44 in the United States with a correlation coefficient (R) of -0.462 and weighted average of 78.9%, a difference of 8.1%.
In Labor Force | Age 35-44 Correlation Summary
| Measurement | Immigrants from Nepal | Native/Alaskan |
| Minimum | 63.4% | 43.8% |
| Maximum | 100.0% | 100.0% |
| Range | 36.6% | 56.2% |
| Mean | 85.5% | 73.5% |
| Median | 85.2% | 75.7% |
| Interquartile 25% (IQ1) | 83.9% | 67.0% |
| Interquartile 75% (IQ3) | 87.7% | 79.7% |
| Interquartile Range (IQR) | 3.8% | 12.7% |
| Standard Deviation (Sample) | 5.7% | 9.6% |
| Standard Deviation (Population) | 5.6% | 9.6% |
Similar Demographics by In Labor Force | Age 35-44
Demographics Similar to Immigrants from Nepal by In Labor Force | Age 35-44
In terms of in labor force | age 35-44, the demographic groups most similar to Immigrants from Nepal are Estonian (85.3%, a difference of 0.0%), Ugandan (85.3%, a difference of 0.020%), Czech (85.3%, a difference of 0.030%), Immigrants from India (85.3%, a difference of 0.030%), and Immigrants from Morocco (85.2%, a difference of 0.030%).
| Demographics | Rating | Rank | In Labor Force | Age 35-44 |
| Immigrants | Lithuania | 99.9 /100 | #27 | Exceptional 85.4% |
| Immigrants | Greece | 99.9 /100 | #28 | Exceptional 85.3% |
| Cambodians | 99.9 /100 | #29 | Exceptional 85.3% |
| Bermudans | 99.9 /100 | #30 | Exceptional 85.3% |
| Czechs | 99.9 /100 | #31 | Exceptional 85.3% |
| Immigrants | India | 99.9 /100 | #32 | Exceptional 85.3% |
| Ugandans | 99.9 /100 | #33 | Exceptional 85.3% |
| Immigrants | Nepal | 99.9 /100 | #34 | Exceptional 85.3% |
| Estonians | 99.9 /100 | #35 | Exceptional 85.3% |
| Immigrants | Morocco | 99.8 /100 | #36 | Exceptional 85.2% |
| Kenyans | 99.8 /100 | #37 | Exceptional 85.2% |
| Immigrants | Poland | 99.8 /100 | #38 | Exceptional 85.2% |
| Eastern Europeans | 99.8 /100 | #39 | Exceptional 85.2% |
| Immigrants | Bulgaria | 99.8 /100 | #40 | Exceptional 85.2% |
| Immigrants | Zimbabwe | 99.8 /100 | #41 | Exceptional 85.2% |
Demographics Similar to Natives/Alaskans by In Labor Force | Age 35-44
In terms of in labor force | age 35-44, the demographic groups most similar to Natives/Alaskans are Yakama (79.0%, a difference of 0.11%), Kiowa (79.2%, a difference of 0.40%), Ute (79.4%, a difference of 0.73%), Houma (79.5%, a difference of 0.79%), and Cheyenne (79.5%, a difference of 0.81%).
| Demographics | Rating | Rank | In Labor Force | Age 35-44 |
| Creek | 0.0 /100 | #328 | Tragic 80.0% |
| Menominee | 0.0 /100 | #329 | Tragic 79.7% |
| Cheyenne | 0.0 /100 | #330 | Tragic 79.5% |
| Houma | 0.0 /100 | #331 | Tragic 79.5% |
| Ute | 0.0 /100 | #332 | Tragic 79.4% |
| Kiowa | 0.0 /100 | #333 | Tragic 79.2% |
| Yakama | 0.0 /100 | #334 | Tragic 79.0% |
| Natives/Alaskans | 0.0 /100 | #335 | Tragic 78.9% |
| Arapaho | 0.0 /100 | #336 | Tragic 78.1% |
| Apache | 0.0 /100 | #337 | Tragic 77.9% |
| Pueblo | 0.0 /100 | #338 | Tragic 77.4% |
| Yup'ik | 0.0 /100 | #339 | Tragic 77.3% |
| Lumbee | 0.0 /100 | #340 | Tragic 77.0% |
| Hopi | 0.0 /100 | #341 | Tragic 77.0% |
| Crow | 0.0 /100 | #342 | Tragic 76.5% |