Immigrants from Croatia vs Immigrants from Burma/Myanmar In Labor Force | Age 35-44
COMPARE
Immigrants from Croatia
Immigrants from Burma/Myanmar
In Labor Force | Age 35-44
In Labor Force | Age 35-44 Comparison
Immigrants from Croatia
Immigrants from Burma/Myanmar
85.1%
IN LABOR FORCE | AGE 35-44
99.5/ 100
METRIC RATING
56th/ 347
METRIC RANK
84.0%
IN LABOR FORCE | AGE 35-44
6.1/ 100
METRIC RATING
225th/ 347
METRIC RANK
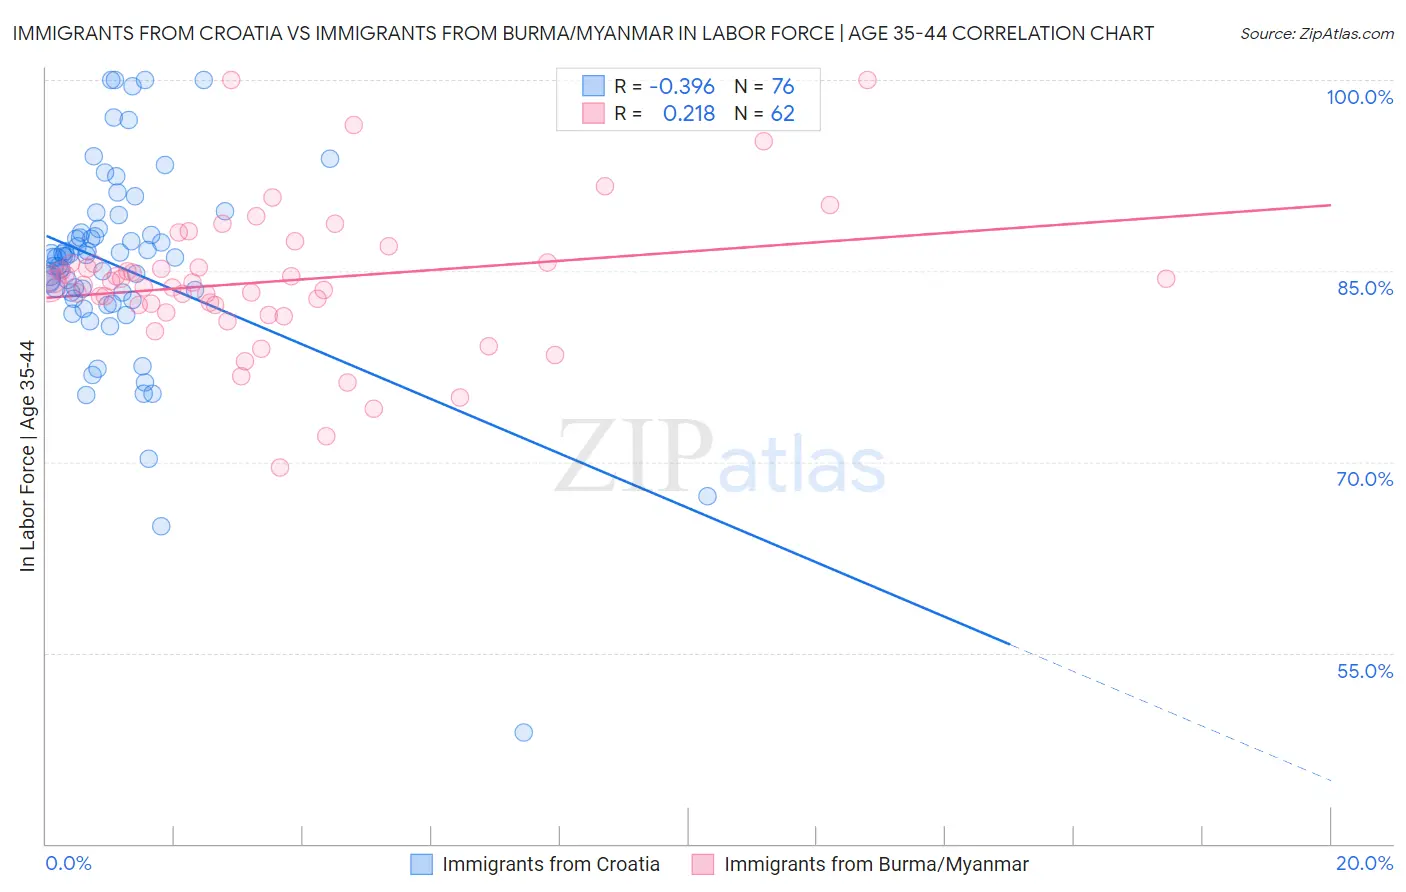
Immigrants from Croatia vs Immigrants from Burma/Myanmar In Labor Force | Age 35-44 Correlation Chart
The statistical analysis conducted on geographies consisting of 132,569,777 people shows a mild negative correlation between the proportion of Immigrants from Croatia and labor force participation rate among population between the ages 35 and 44 in the United States with a correlation coefficient (R) of -0.396 and weighted average of 85.1%. Similarly, the statistical analysis conducted on geographies consisting of 172,270,832 people shows a weak positive correlation between the proportion of Immigrants from Burma/Myanmar and labor force participation rate among population between the ages 35 and 44 in the United States with a correlation coefficient (R) of 0.218 and weighted average of 84.0%, a difference of 1.3%.
In Labor Force | Age 35-44 Correlation Summary
| Measurement | Immigrants from Croatia | Immigrants from Burma/Myanmar |
| Minimum | 48.7% | 69.6% |
| Maximum | 100.0% | 100.0% |
| Range | 51.3% | 30.4% |
| Mean | 85.3% | 84.2% |
| Median | 86.1% | 84.1% |
| Interquartile 25% (IQ1) | 82.8% | 82.3% |
| Interquartile 75% (IQ3) | 87.9% | 85.6% |
| Interquartile Range (IQR) | 5.2% | 3.3% |
| Standard Deviation (Sample) | 8.1% | 5.6% |
| Standard Deviation (Population) | 8.0% | 5.5% |
Similar Demographics by In Labor Force | Age 35-44
Demographics Similar to Immigrants from Croatia by In Labor Force | Age 35-44
In terms of in labor force | age 35-44, the demographic groups most similar to Immigrants from Croatia are Turkish (85.1%, a difference of 0.010%), Soviet Union (85.1%, a difference of 0.010%), Chinese (85.1%, a difference of 0.020%), Slovak (85.1%, a difference of 0.020%), and Serbian (85.1%, a difference of 0.020%).
| Demographics | Rating | Rank | In Labor Force | Age 35-44 |
| Croatians | 99.7 /100 | #49 | Exceptional 85.2% |
| Thais | 99.7 /100 | #50 | Exceptional 85.2% |
| Immigrants | Albania | 99.7 /100 | #51 | Exceptional 85.1% |
| Immigrants | Kenya | 99.6 /100 | #52 | Exceptional 85.1% |
| Taiwanese | 99.6 /100 | #53 | Exceptional 85.1% |
| Turks | 99.5 /100 | #54 | Exceptional 85.1% |
| Soviet Union | 99.5 /100 | #55 | Exceptional 85.1% |
| Immigrants | Croatia | 99.5 /100 | #56 | Exceptional 85.1% |
| Chinese | 99.4 /100 | #57 | Exceptional 85.1% |
| Slovaks | 99.4 /100 | #58 | Exceptional 85.1% |
| Serbians | 99.4 /100 | #59 | Exceptional 85.1% |
| Albanians | 99.4 /100 | #60 | Exceptional 85.1% |
| Immigrants | Latvia | 99.3 /100 | #61 | Exceptional 85.0% |
| Immigrants | Moldova | 99.3 /100 | #62 | Exceptional 85.0% |
| Immigrants | Uganda | 99.3 /100 | #63 | Exceptional 85.0% |
Demographics Similar to Immigrants from Burma/Myanmar by In Labor Force | Age 35-44
In terms of in labor force | age 35-44, the demographic groups most similar to Immigrants from Burma/Myanmar are U.S. Virgin Islander (84.0%, a difference of 0.0%), Assyrian/Chaldean/Syriac (84.0%, a difference of 0.010%), Immigrants from Panama (84.0%, a difference of 0.010%), Icelander (84.0%, a difference of 0.020%), and Panamanian (84.0%, a difference of 0.020%).
| Demographics | Rating | Rank | In Labor Force | Age 35-44 |
| Immigrants | Nicaragua | 9.4 /100 | #218 | Tragic 84.1% |
| Sub-Saharan Africans | 9.3 /100 | #219 | Tragic 84.1% |
| French | 7.5 /100 | #220 | Tragic 84.0% |
| Icelanders | 6.7 /100 | #221 | Tragic 84.0% |
| Assyrians/Chaldeans/Syriacs | 6.6 /100 | #222 | Tragic 84.0% |
| Immigrants | Panama | 6.4 /100 | #223 | Tragic 84.0% |
| U.S. Virgin Islanders | 6.1 /100 | #224 | Tragic 84.0% |
| Immigrants | Burma/Myanmar | 6.1 /100 | #225 | Tragic 84.0% |
| Panamanians | 5.4 /100 | #226 | Tragic 84.0% |
| British West Indians | 5.3 /100 | #227 | Tragic 84.0% |
| Welsh | 5.3 /100 | #228 | Tragic 84.0% |
| Immigrants | Thailand | 4.7 /100 | #229 | Tragic 84.0% |
| Immigrants | Iraq | 3.7 /100 | #230 | Tragic 83.9% |
| Scottish | 3.2 /100 | #231 | Tragic 83.9% |
| Native Hawaiians | 3.0 /100 | #232 | Tragic 83.9% |