Immigrants from Croatia vs Immigrants from Cuba In Labor Force | Age 35-44
COMPARE
Immigrants from Croatia
Immigrants from Cuba
In Labor Force | Age 35-44
In Labor Force | Age 35-44 Comparison
Immigrants from Croatia
Immigrants from Cuba
85.1%
IN LABOR FORCE | AGE 35-44
99.5/ 100
METRIC RATING
56th/ 347
METRIC RANK
84.9%
IN LABOR FORCE | AGE 35-44
98.6/ 100
METRIC RATING
76th/ 347
METRIC RANK
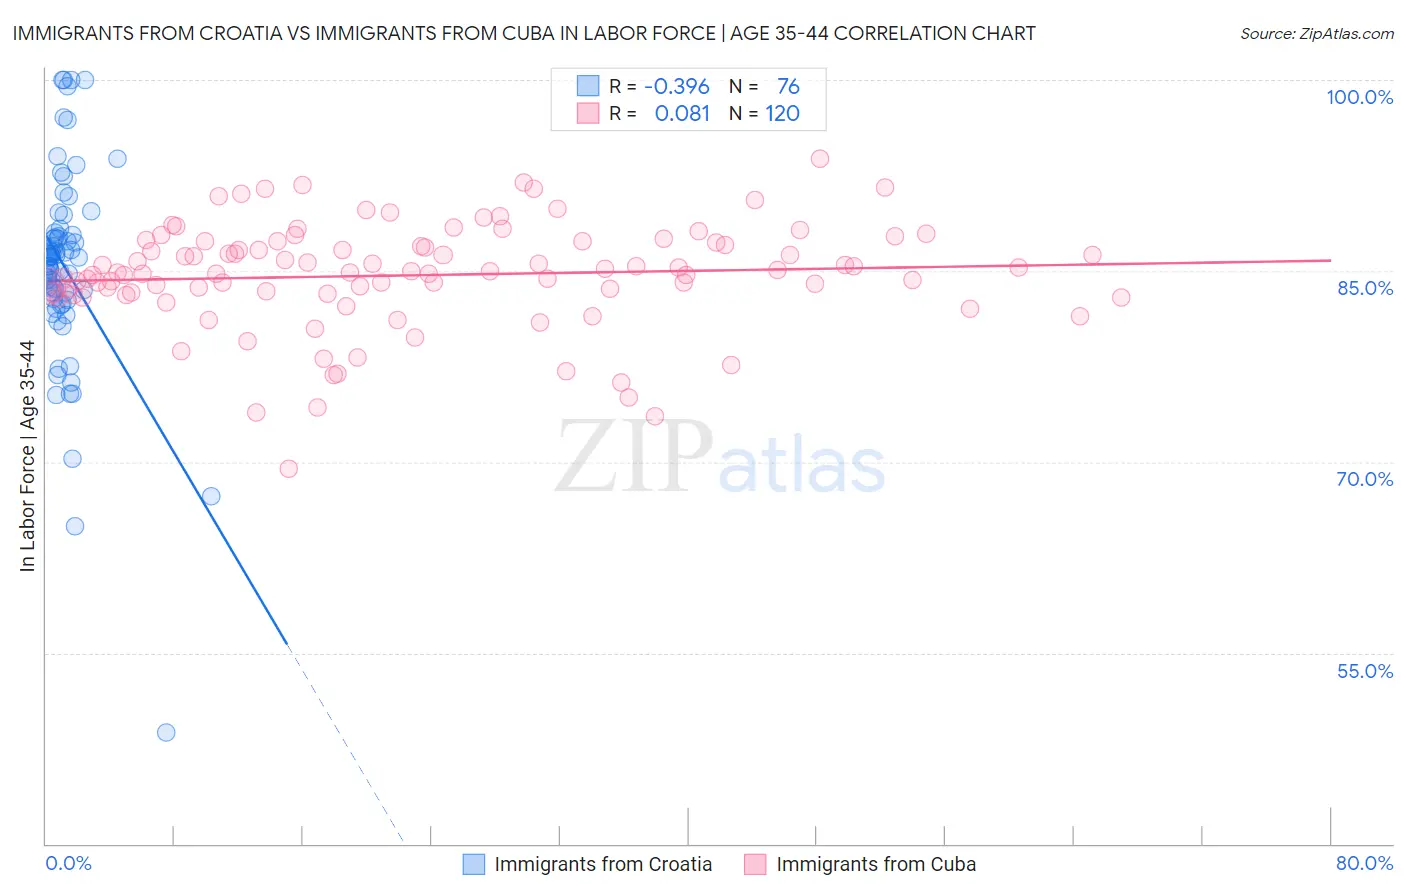
Immigrants from Croatia vs Immigrants from Cuba In Labor Force | Age 35-44 Correlation Chart
The statistical analysis conducted on geographies consisting of 132,569,777 people shows a mild negative correlation between the proportion of Immigrants from Croatia and labor force participation rate among population between the ages 35 and 44 in the United States with a correlation coefficient (R) of -0.396 and weighted average of 85.1%. Similarly, the statistical analysis conducted on geographies consisting of 325,923,342 people shows a slight positive correlation between the proportion of Immigrants from Cuba and labor force participation rate among population between the ages 35 and 44 in the United States with a correlation coefficient (R) of 0.081 and weighted average of 84.9%, a difference of 0.16%.
In Labor Force | Age 35-44 Correlation Summary
| Measurement | Immigrants from Croatia | Immigrants from Cuba |
| Minimum | 48.7% | 69.5% |
| Maximum | 100.0% | 93.8% |
| Range | 51.3% | 24.3% |
| Mean | 85.3% | 84.7% |
| Median | 86.1% | 85.0% |
| Interquartile 25% (IQ1) | 82.8% | 83.2% |
| Interquartile 75% (IQ3) | 87.9% | 87.3% |
| Interquartile Range (IQR) | 5.2% | 4.0% |
| Standard Deviation (Sample) | 8.1% | 4.2% |
| Standard Deviation (Population) | 8.0% | 4.1% |
Demographics Similar to Immigrants from Croatia and Immigrants from Cuba by In Labor Force | Age 35-44
In terms of in labor force | age 35-44, the demographic groups most similar to Immigrants from Croatia are Chinese (85.1%, a difference of 0.020%), Slovak (85.1%, a difference of 0.020%), Serbian (85.1%, a difference of 0.020%), Albanian (85.1%, a difference of 0.030%), and Immigrants from Latvia (85.0%, a difference of 0.050%). Similarly, the demographic groups most similar to Immigrants from Cuba are Immigrants from South Central Asia (85.0%, a difference of 0.010%), Colombian (85.0%, a difference of 0.020%), Immigrants from Singapore (85.0%, a difference of 0.030%), Immigrants from Sri Lanka (85.0%, a difference of 0.030%), and Russian (85.0%, a difference of 0.050%).
| Demographics | Rating | Rank | In Labor Force | Age 35-44 |
| Immigrants | Croatia | 99.5 /100 | #56 | Exceptional 85.1% |
| Chinese | 99.4 /100 | #57 | Exceptional 85.1% |
| Slovaks | 99.4 /100 | #58 | Exceptional 85.1% |
| Serbians | 99.4 /100 | #59 | Exceptional 85.1% |
| Albanians | 99.4 /100 | #60 | Exceptional 85.1% |
| Immigrants | Latvia | 99.3 /100 | #61 | Exceptional 85.0% |
| Immigrants | Moldova | 99.3 /100 | #62 | Exceptional 85.0% |
| Immigrants | Uganda | 99.3 /100 | #63 | Exceptional 85.0% |
| Swedes | 99.2 /100 | #64 | Exceptional 85.0% |
| Immigrants | Brazil | 99.2 /100 | #65 | Exceptional 85.0% |
| Immigrants | Haiti | 99.1 /100 | #66 | Exceptional 85.0% |
| Immigrants | Italy | 99.1 /100 | #67 | Exceptional 85.0% |
| Italians | 99.1 /100 | #68 | Exceptional 85.0% |
| Sudanese | 99.0 /100 | #69 | Exceptional 85.0% |
| Brazilians | 99.0 /100 | #70 | Exceptional 85.0% |
| Russians | 99.0 /100 | #71 | Exceptional 85.0% |
| Immigrants | Singapore | 98.9 /100 | #72 | Exceptional 85.0% |
| Immigrants | Sri Lanka | 98.9 /100 | #73 | Exceptional 85.0% |
| Colombians | 98.8 /100 | #74 | Exceptional 85.0% |
| Immigrants | South Central Asia | 98.7 /100 | #75 | Exceptional 85.0% |
| Immigrants | Cuba | 98.6 /100 | #76 | Exceptional 84.9% |