Immigrants from Japan vs Native/Alaskan In Labor Force | Age 35-44
COMPARE
Immigrants from Japan
Native/Alaskan
In Labor Force | Age 35-44
In Labor Force | Age 35-44 Comparison
Immigrants from Japan
Natives/Alaskans
84.6%
IN LABOR FORCE | AGE 35-44
81.4/ 100
METRIC RATING
140th/ 347
METRIC RANK
78.9%
IN LABOR FORCE | AGE 35-44
0.0/ 100
METRIC RATING
335th/ 347
METRIC RANK
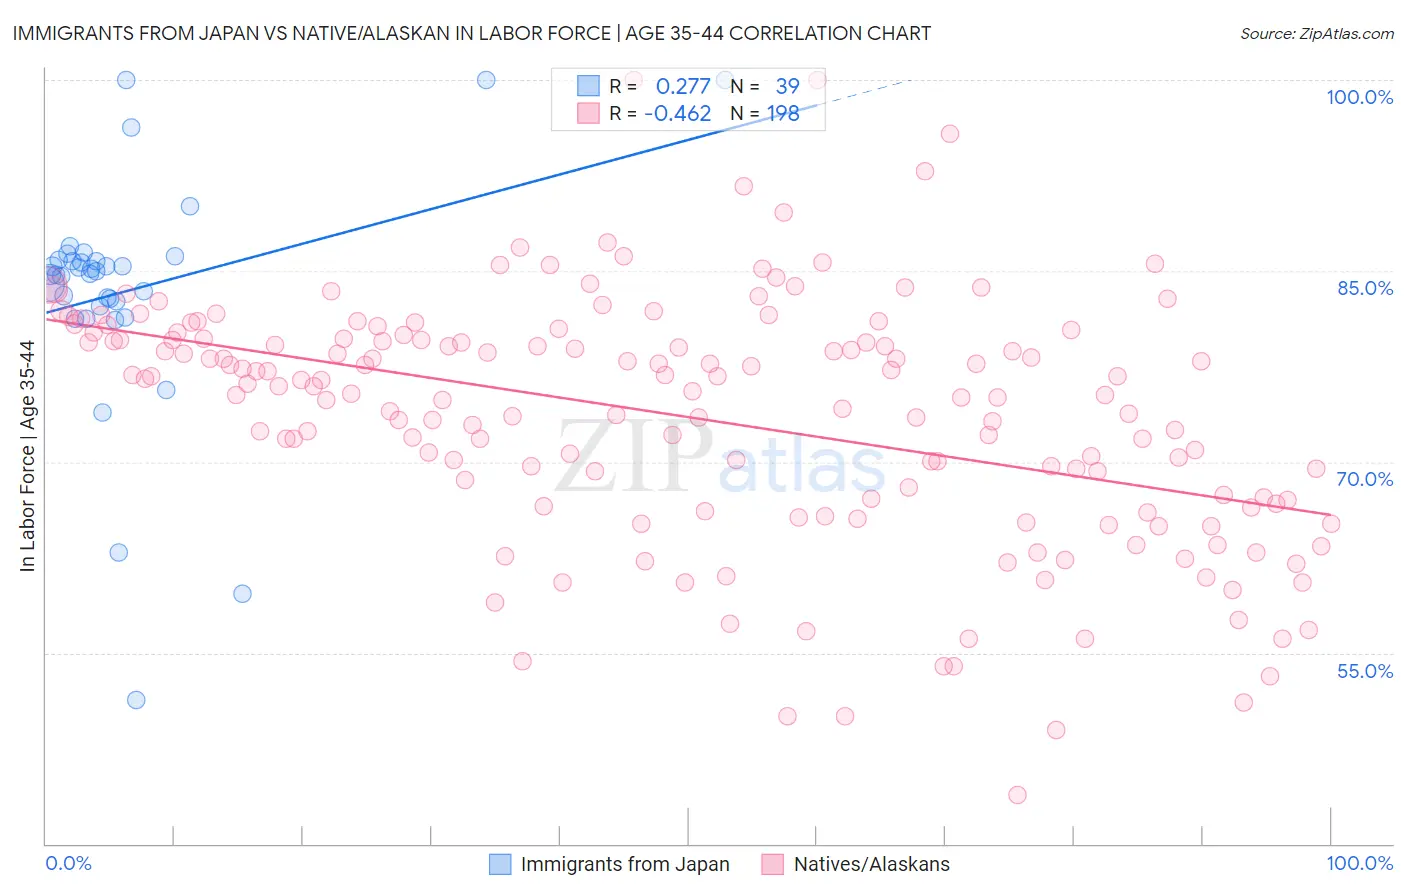
Immigrants from Japan vs Native/Alaskan In Labor Force | Age 35-44 Correlation Chart
The statistical analysis conducted on geographies consisting of 340,027,391 people shows a weak positive correlation between the proportion of Immigrants from Japan and labor force participation rate among population between the ages 35 and 44 in the United States with a correlation coefficient (R) of 0.277 and weighted average of 84.6%. Similarly, the statistical analysis conducted on geographies consisting of 512,690,286 people shows a moderate negative correlation between the proportion of Natives/Alaskans and labor force participation rate among population between the ages 35 and 44 in the United States with a correlation coefficient (R) of -0.462 and weighted average of 78.9%, a difference of 7.2%.
In Labor Force | Age 35-44 Correlation Summary
| Measurement | Immigrants from Japan | Native/Alaskan |
| Minimum | 51.3% | 43.8% |
| Maximum | 100.0% | 100.0% |
| Range | 48.7% | 56.2% |
| Mean | 83.5% | 73.5% |
| Median | 84.7% | 75.7% |
| Interquartile 25% (IQ1) | 82.3% | 67.0% |
| Interquartile 75% (IQ3) | 85.9% | 79.7% |
| Interquartile Range (IQR) | 3.6% | 12.7% |
| Standard Deviation (Sample) | 9.3% | 9.6% |
| Standard Deviation (Population) | 9.2% | 9.6% |
Similar Demographics by In Labor Force | Age 35-44
Demographics Similar to Immigrants from Japan by In Labor Force | Age 35-44
In terms of in labor force | age 35-44, the demographic groups most similar to Immigrants from Japan are Czechoslovakian (84.6%, a difference of 0.010%), Immigrants from Zaire (84.6%, a difference of 0.010%), Immigrants from Belgium (84.6%, a difference of 0.010%), Immigrants from Uruguay (84.6%, a difference of 0.010%), and Immigrants from Ukraine (84.6%, a difference of 0.020%).
| Demographics | Rating | Rank | In Labor Force | Age 35-44 |
| Argentineans | 88.4 /100 | #133 | Excellent 84.6% |
| Immigrants | Korea | 88.2 /100 | #134 | Excellent 84.6% |
| Immigrants | Malaysia | 87.5 /100 | #135 | Excellent 84.6% |
| Afghans | 86.3 /100 | #136 | Excellent 84.6% |
| Immigrants | Chile | 84.6 /100 | #137 | Excellent 84.6% |
| Czechoslovakians | 82.6 /100 | #138 | Excellent 84.6% |
| Immigrants | Zaire | 82.5 /100 | #139 | Excellent 84.6% |
| Immigrants | Japan | 81.4 /100 | #140 | Excellent 84.6% |
| Immigrants | Belgium | 80.8 /100 | #141 | Excellent 84.6% |
| Immigrants | Uruguay | 80.1 /100 | #142 | Excellent 84.6% |
| Immigrants | Ukraine | 79.7 /100 | #143 | Good 84.6% |
| Immigrants | Jamaica | 79.4 /100 | #144 | Good 84.6% |
| Immigrants | Saudi Arabia | 79.4 /100 | #145 | Good 84.6% |
| Immigrants | Asia | 78.7 /100 | #146 | Good 84.5% |
| Immigrants | Netherlands | 76.6 /100 | #147 | Good 84.5% |
Demographics Similar to Natives/Alaskans by In Labor Force | Age 35-44
In terms of in labor force | age 35-44, the demographic groups most similar to Natives/Alaskans are Yakama (79.0%, a difference of 0.11%), Kiowa (79.2%, a difference of 0.40%), Ute (79.4%, a difference of 0.73%), Houma (79.5%, a difference of 0.79%), and Cheyenne (79.5%, a difference of 0.81%).
| Demographics | Rating | Rank | In Labor Force | Age 35-44 |
| Creek | 0.0 /100 | #328 | Tragic 80.0% |
| Menominee | 0.0 /100 | #329 | Tragic 79.7% |
| Cheyenne | 0.0 /100 | #330 | Tragic 79.5% |
| Houma | 0.0 /100 | #331 | Tragic 79.5% |
| Ute | 0.0 /100 | #332 | Tragic 79.4% |
| Kiowa | 0.0 /100 | #333 | Tragic 79.2% |
| Yakama | 0.0 /100 | #334 | Tragic 79.0% |
| Natives/Alaskans | 0.0 /100 | #335 | Tragic 78.9% |
| Arapaho | 0.0 /100 | #336 | Tragic 78.1% |
| Apache | 0.0 /100 | #337 | Tragic 77.9% |
| Pueblo | 0.0 /100 | #338 | Tragic 77.4% |
| Yup'ik | 0.0 /100 | #339 | Tragic 77.3% |
| Lumbee | 0.0 /100 | #340 | Tragic 77.0% |
| Hopi | 0.0 /100 | #341 | Tragic 77.0% |
| Crow | 0.0 /100 | #342 | Tragic 76.5% |