Immigrants from Kazakhstan vs Bahamian In Labor Force | Age > 16
COMPARE
Immigrants from Kazakhstan
Bahamian
In Labor Force | Age > 16
In Labor Force | Age > 16 Comparison
Immigrants from Kazakhstan
Bahamians
65.3%
IN LABOR FORCE | AGE > 16
68.1/ 100
METRIC RATING
165th/ 347
METRIC RANK
64.2%
IN LABOR FORCE | AGE > 16
0.6/ 100
METRIC RATING
263rd/ 347
METRIC RANK
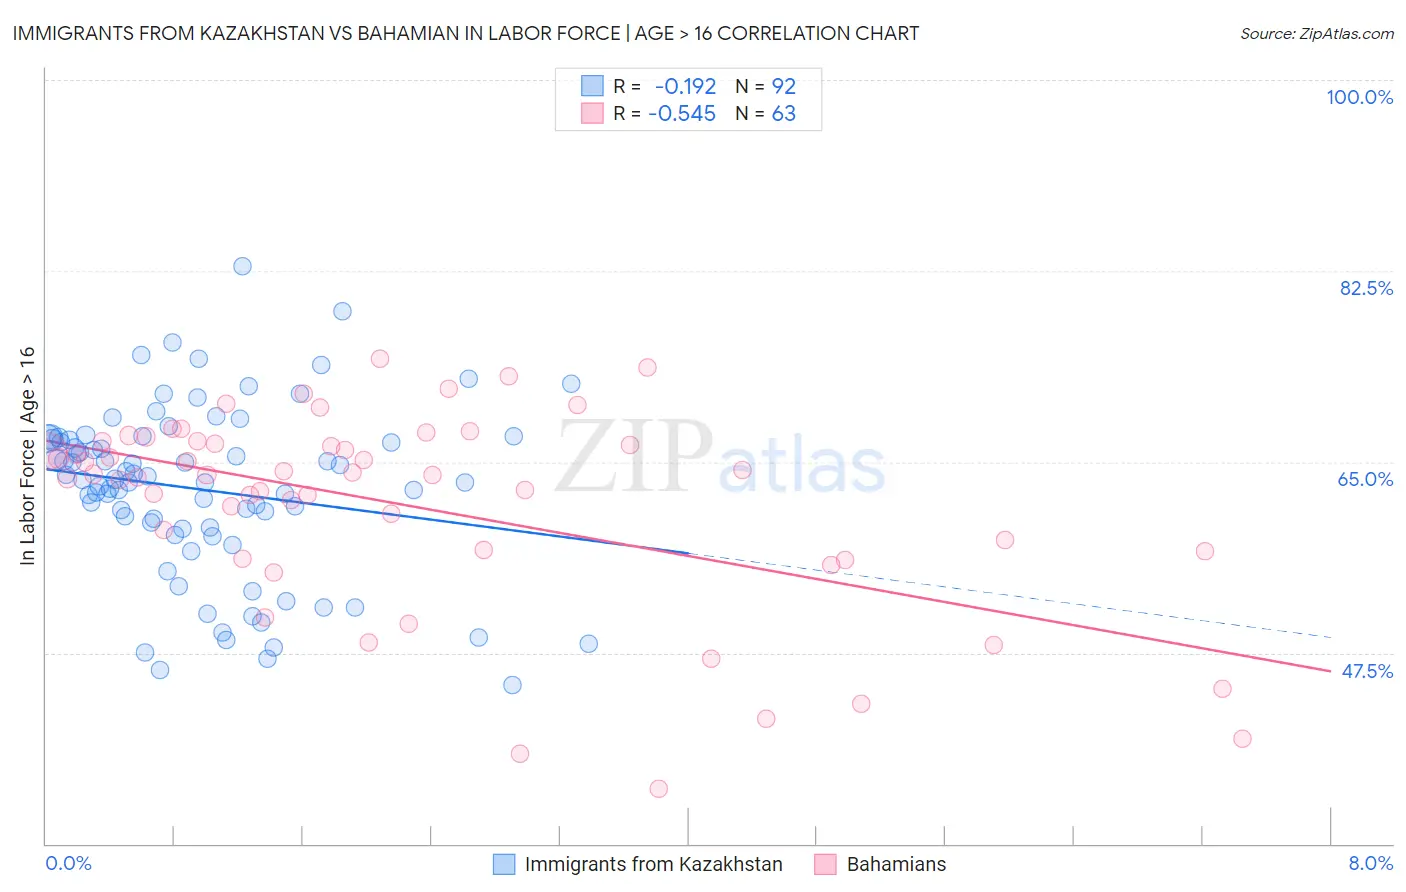
Immigrants from Kazakhstan vs Bahamian In Labor Force | Age > 16 Correlation Chart
The statistical analysis conducted on geographies consisting of 124,444,172 people shows a poor negative correlation between the proportion of Immigrants from Kazakhstan and labor force participation rate among population ages 16 and over in the United States with a correlation coefficient (R) of -0.192 and weighted average of 65.3%. Similarly, the statistical analysis conducted on geographies consisting of 112,706,440 people shows a substantial negative correlation between the proportion of Bahamians and labor force participation rate among population ages 16 and over in the United States with a correlation coefficient (R) of -0.545 and weighted average of 64.2%, a difference of 1.7%.
In Labor Force | Age > 16 Correlation Summary
| Measurement | Immigrants from Kazakhstan | Bahamian |
| Minimum | 44.6% | 35.0% |
| Maximum | 82.9% | 74.5% |
| Range | 38.3% | 39.5% |
| Mean | 62.4% | 61.0% |
| Median | 63.4% | 63.8% |
| Interquartile 25% (IQ1) | 58.9% | 56.8% |
| Interquartile 75% (IQ3) | 67.1% | 66.9% |
| Interquartile Range (IQR) | 8.1% | 10.1% |
| Standard Deviation (Sample) | 7.8% | 9.1% |
| Standard Deviation (Population) | 7.7% | 9.1% |
Similar Demographics by In Labor Force | Age > 16
Demographics Similar to Immigrants from Kazakhstan by In Labor Force | Age > 16
In terms of in labor force | age > 16, the demographic groups most similar to Immigrants from Kazakhstan are Danish (65.3%, a difference of 0.010%), Immigrants from Western Asia (65.3%, a difference of 0.010%), South African (65.3%, a difference of 0.020%), Immigrants from Belarus (65.2%, a difference of 0.030%), and Australian (65.3%, a difference of 0.040%).
| Demographics | Rating | Rank | In Labor Force | Age > 16 |
| Panamanians | 75.2 /100 | #158 | Good 65.3% |
| Immigrants | Syria | 74.6 /100 | #159 | Good 65.3% |
| Immigrants | South Africa | 73.5 /100 | #160 | Good 65.3% |
| Australians | 71.3 /100 | #161 | Good 65.3% |
| Albanians | 70.8 /100 | #162 | Good 65.3% |
| South Africans | 69.8 /100 | #163 | Good 65.3% |
| Danes | 68.8 /100 | #164 | Good 65.3% |
| Immigrants | Kazakhstan | 68.1 /100 | #165 | Good 65.3% |
| Immigrants | Western Asia | 67.3 /100 | #166 | Good 65.3% |
| Immigrants | Belarus | 66.0 /100 | #167 | Good 65.2% |
| Serbians | 63.5 /100 | #168 | Good 65.2% |
| Arabs | 62.4 /100 | #169 | Good 65.2% |
| Immigrants | Israel | 61.7 /100 | #170 | Good 65.2% |
| Israelis | 61.6 /100 | #171 | Good 65.2% |
| Immigrants | Sweden | 61.3 /100 | #172 | Good 65.2% |
Demographics Similar to Bahamians by In Labor Force | Age > 16
In terms of in labor force | age > 16, the demographic groups most similar to Bahamians are Finnish (64.2%, a difference of 0.010%), Dutch (64.2%, a difference of 0.020%), Marshallese (64.2%, a difference of 0.030%), Basque (64.2%, a difference of 0.030%), and Immigrants from Western Europe (64.2%, a difference of 0.040%).
| Demographics | Rating | Rank | In Labor Force | Age > 16 |
| Immigrants | Mexico | 1.0 /100 | #256 | Tragic 64.3% |
| Inupiat | 0.8 /100 | #257 | Tragic 64.3% |
| Immigrants | Scotland | 0.8 /100 | #258 | Tragic 64.2% |
| Immigrants | Western Europe | 0.7 /100 | #259 | Tragic 64.2% |
| Marshallese | 0.7 /100 | #260 | Tragic 64.2% |
| Basques | 0.7 /100 | #261 | Tragic 64.2% |
| Finns | 0.7 /100 | #262 | Tragic 64.2% |
| Bahamians | 0.6 /100 | #263 | Tragic 64.2% |
| Dutch | 0.6 /100 | #264 | Tragic 64.2% |
| Cubans | 0.5 /100 | #265 | Tragic 64.2% |
| Immigrants | England | 0.5 /100 | #266 | Tragic 64.2% |
| Canadians | 0.5 /100 | #267 | Tragic 64.1% |
| Spaniards | 0.5 /100 | #268 | Tragic 64.1% |
| Irish | 0.4 /100 | #269 | Tragic 64.1% |
| Guyanese | 0.4 /100 | #270 | Tragic 64.1% |