Immigrants from Congo vs Potawatomi Single Father Households
COMPARE
Immigrants from Congo
Potawatomi
Single Father Households
Single Father Households Comparison
Immigrants from Congo
Potawatomi
2.5%
SINGLE FATHER HOUSEHOLDS
1.2/ 100
METRIC RATING
257th/ 347
METRIC RANK
2.5%
SINGLE FATHER HOUSEHOLDS
1.4/ 100
METRIC RATING
256th/ 347
METRIC RANK
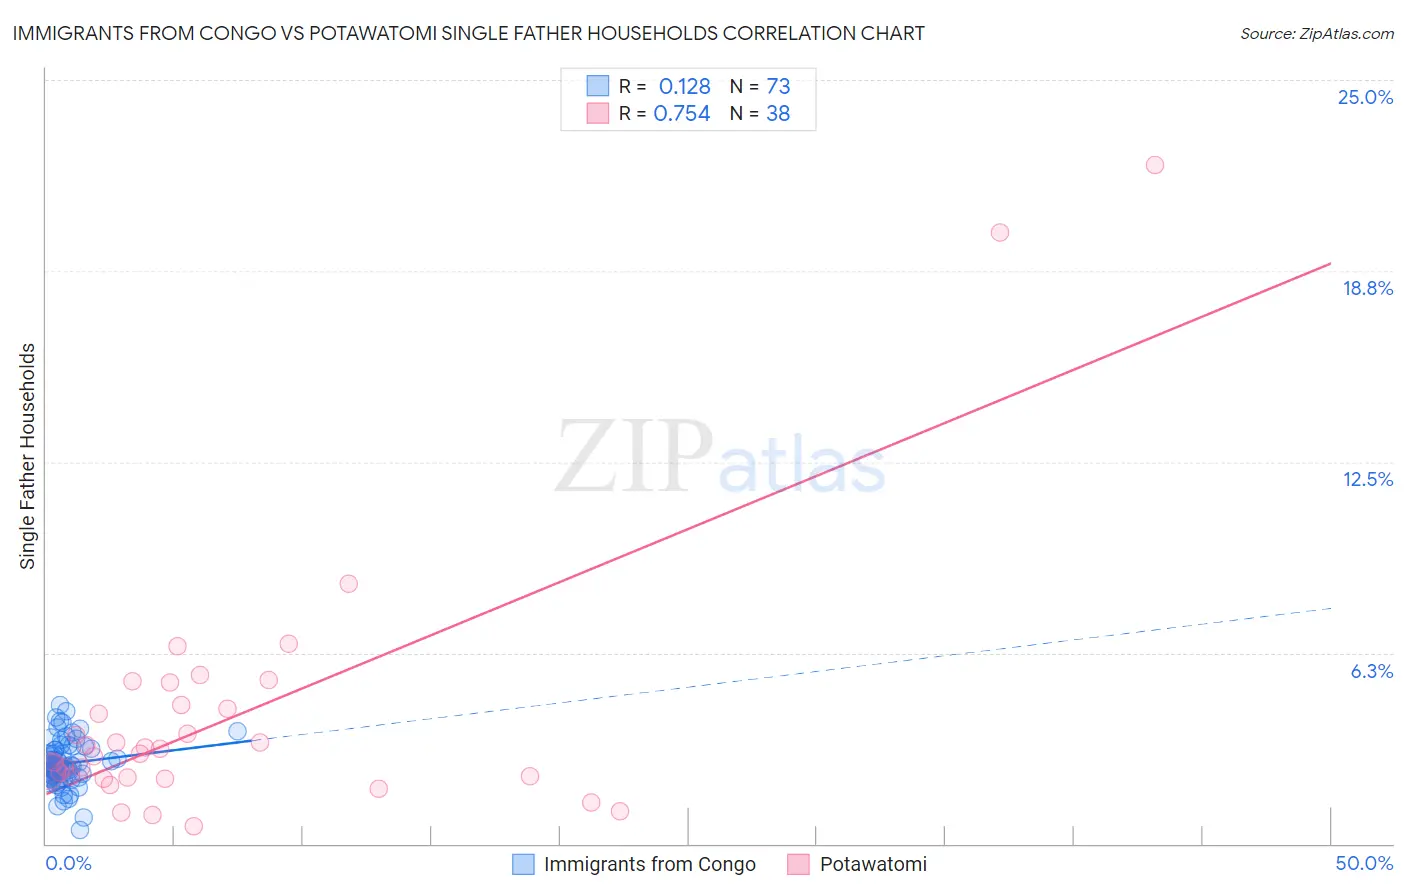
Immigrants from Congo vs Potawatomi Single Father Households Correlation Chart
The statistical analysis conducted on geographies consisting of 91,926,363 people shows a poor positive correlation between the proportion of Immigrants from Congo and percentage of single father households in the United States with a correlation coefficient (R) of 0.128 and weighted average of 2.5%. Similarly, the statistical analysis conducted on geographies consisting of 117,445,996 people shows a strong positive correlation between the proportion of Potawatomi and percentage of single father households in the United States with a correlation coefficient (R) of 0.754 and weighted average of 2.5%, a difference of 0.29%.
Single Father Households Correlation Summary
| Measurement | Immigrants from Congo | Potawatomi |
| Minimum | 0.46% | 0.58% |
| Maximum | 4.5% | 22.2% |
| Range | 4.1% | 21.6% |
| Mean | 2.6% | 4.2% |
| Median | 2.5% | 3.0% |
| Interquartile 25% (IQ1) | 2.2% | 2.2% |
| Interquartile 75% (IQ3) | 3.1% | 4.5% |
| Interquartile Range (IQR) | 0.93% | 2.4% |
| Standard Deviation (Sample) | 0.77% | 4.4% |
| Standard Deviation (Population) | 0.76% | 4.3% |
Demographics Similar to Immigrants from Congo and Potawatomi by Single Father Households
In terms of single father households, the demographic groups most similar to Immigrants from Congo are Spanish (2.5%, a difference of 0.090%), Comanche (2.5%, a difference of 0.24%), Immigrants from Caribbean (2.5%, a difference of 0.33%), Tongan (2.5%, a difference of 0.34%), and Immigrants from Belize (2.5%, a difference of 0.49%). Similarly, the demographic groups most similar to Potawatomi are Tongan (2.5%, a difference of 0.060%), Spanish (2.5%, a difference of 0.37%), Immigrants from Thailand (2.5%, a difference of 0.47%), Immigrants from Somalia (2.5%, a difference of 0.51%), and Comanche (2.5%, a difference of 0.53%).
| Demographics | Rating | Rank | Single Father Households |
| Native Hawaiians | 2.5 /100 | #246 | Tragic 2.5% |
| Delaware | 2.5 /100 | #247 | Tragic 2.5% |
| Bahamians | 2.4 /100 | #248 | Tragic 2.5% |
| Immigrants | Cameroon | 2.3 /100 | #249 | Tragic 2.5% |
| Somalis | 2.1 /100 | #250 | Tragic 2.5% |
| Liberians | 2.0 /100 | #251 | Tragic 2.5% |
| Immigrants | Eritrea | 2.0 /100 | #252 | Tragic 2.5% |
| Immigrants | Somalia | 1.9 /100 | #253 | Tragic 2.5% |
| Immigrants | Thailand | 1.8 /100 | #254 | Tragic 2.5% |
| Tongans | 1.5 /100 | #255 | Tragic 2.5% |
| Potawatomi | 1.4 /100 | #256 | Tragic 2.5% |
| Immigrants | Congo | 1.2 /100 | #257 | Tragic 2.5% |
| Spanish | 1.1 /100 | #258 | Tragic 2.5% |
| Comanche | 1.0 /100 | #259 | Tragic 2.5% |
| Immigrants | Caribbean | 1.0 /100 | #260 | Tragic 2.5% |
| Immigrants | Belize | 0.9 /100 | #261 | Tragic 2.5% |
| Immigrants | Liberia | 0.8 /100 | #262 | Tragic 2.5% |
| Dominicans | 0.8 /100 | #263 | Tragic 2.5% |
| Indonesians | 0.5 /100 | #264 | Tragic 2.6% |
| Immigrants | Micronesia | 0.5 /100 | #265 | Tragic 2.6% |
| French American Indians | 0.5 /100 | #266 | Tragic 2.6% |