Immigrants from Congo vs Black/African American In Labor Force | Age 20-64
COMPARE
Immigrants from Congo
Black/African American
In Labor Force | Age 20-64
In Labor Force | Age 20-64 Comparison
Immigrants from Congo
Blacks/African Americans
79.3%
IN LABOR FORCE | AGE 20-64
17.5/ 100
METRIC RATING
205th/ 347
METRIC RANK
76.8%
IN LABOR FORCE | AGE 20-64
0.0/ 100
METRIC RATING
314th/ 347
METRIC RANK
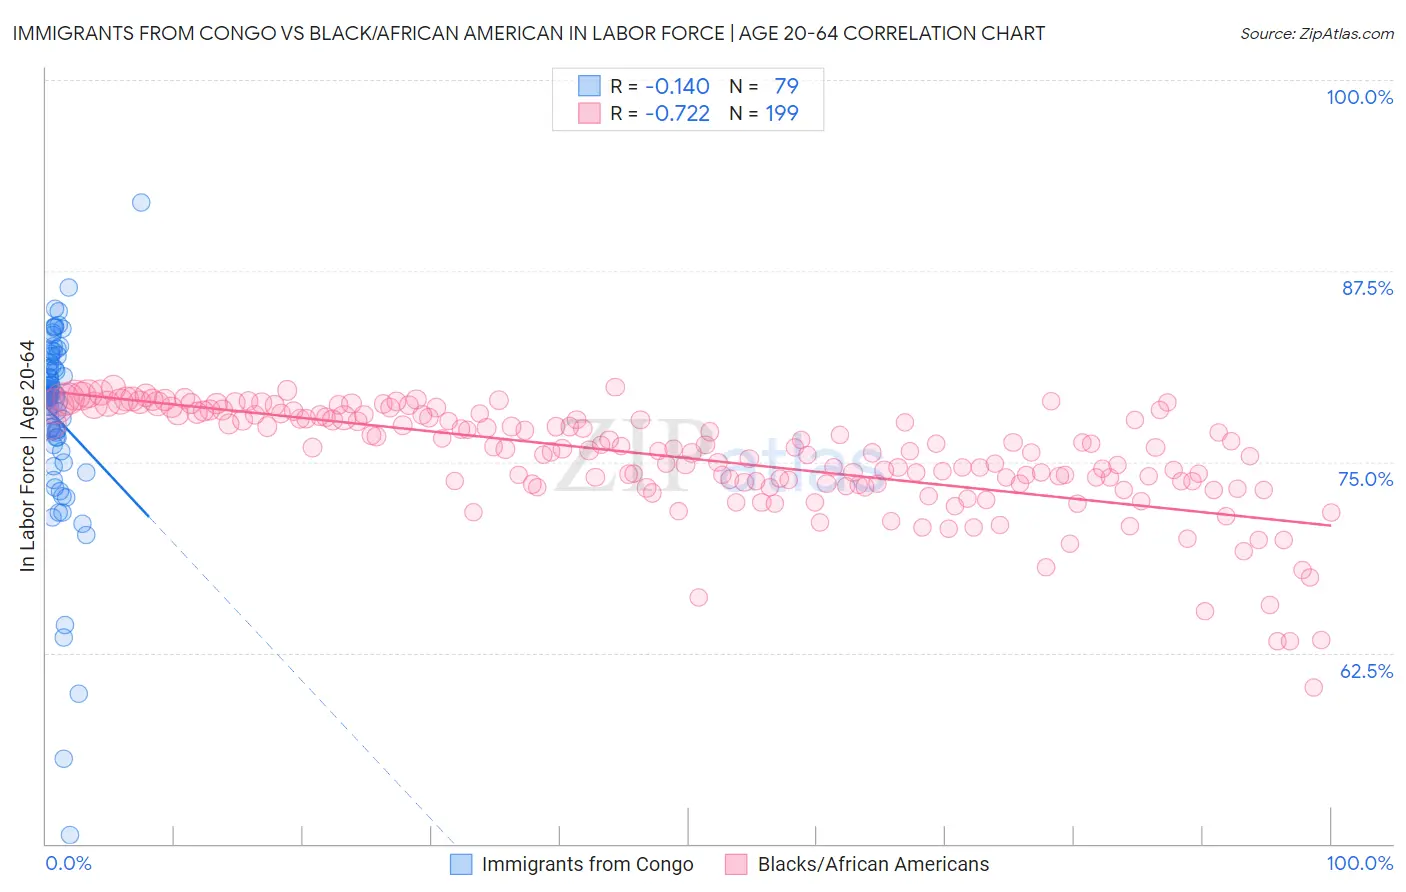
Immigrants from Congo vs Black/African American In Labor Force | Age 20-64 Correlation Chart
The statistical analysis conducted on geographies consisting of 92,129,118 people shows a poor negative correlation between the proportion of Immigrants from Congo and labor force participation rate among population between the ages 20 and 64 in the United States with a correlation coefficient (R) of -0.140 and weighted average of 79.3%. Similarly, the statistical analysis conducted on geographies consisting of 566,027,393 people shows a strong negative correlation between the proportion of Blacks/African Americans and labor force participation rate among population between the ages 20 and 64 in the United States with a correlation coefficient (R) of -0.722 and weighted average of 76.8%, a difference of 3.3%.
In Labor Force | Age 20-64 Correlation Summary
| Measurement | Immigrants from Congo | Black/African American |
| Minimum | 50.6% | 60.2% |
| Maximum | 92.0% | 79.9% |
| Range | 41.4% | 19.7% |
| Mean | 77.8% | 75.3% |
| Median | 79.3% | 75.9% |
| Interquartile 25% (IQ1) | 76.1% | 73.6% |
| Interquartile 75% (IQ3) | 81.5% | 78.1% |
| Interquartile Range (IQR) | 5.4% | 4.5% |
| Standard Deviation (Sample) | 6.4% | 3.5% |
| Standard Deviation (Population) | 6.4% | 3.5% |
Similar Demographics by In Labor Force | Age 20-64
Demographics Similar to Immigrants from Congo by In Labor Force | Age 20-64
In terms of in labor force | age 20-64, the demographic groups most similar to Immigrants from Congo are Iraqi (79.3%, a difference of 0.0%), Immigrants from Cambodia (79.3%, a difference of 0.0%), Nicaraguan (79.3%, a difference of 0.010%), Immigrants from Ecuador (79.3%, a difference of 0.010%), and Subsaharan African (79.3%, a difference of 0.010%).
| Demographics | Rating | Rank | In Labor Force | Age 20-64 |
| Immigrants | Laos | 21.5 /100 | #198 | Fair 79.4% |
| Dutch | 20.2 /100 | #199 | Fair 79.3% |
| Immigrants | Oceania | 19.1 /100 | #200 | Poor 79.3% |
| Immigrants | Nicaragua | 19.0 /100 | #201 | Poor 79.3% |
| Nicaraguans | 18.3 /100 | #202 | Poor 79.3% |
| Iraqis | 17.7 /100 | #203 | Poor 79.3% |
| Immigrants | Cambodia | 17.6 /100 | #204 | Poor 79.3% |
| Immigrants | Congo | 17.5 /100 | #205 | Poor 79.3% |
| Immigrants | Ecuador | 16.9 /100 | #206 | Poor 79.3% |
| Sub-Saharan Africans | 16.5 /100 | #207 | Poor 79.3% |
| British | 16.5 /100 | #208 | Poor 79.3% |
| Bangladeshis | 16.4 /100 | #209 | Poor 79.3% |
| Haitians | 16.1 /100 | #210 | Poor 79.3% |
| Europeans | 15.3 /100 | #211 | Poor 79.3% |
| Irish | 13.2 /100 | #212 | Poor 79.3% |
Demographics Similar to Blacks/African Americans by In Labor Force | Age 20-64
In terms of in labor force | age 20-64, the demographic groups most similar to Blacks/African Americans are Shoshone (76.8%, a difference of 0.020%), Ottawa (76.7%, a difference of 0.10%), Alaskan Athabascan (76.9%, a difference of 0.14%), Yaqui (76.5%, a difference of 0.29%), and Blackfeet (77.0%, a difference of 0.31%).
| Demographics | Rating | Rank | In Labor Force | Age 20-64 |
| Central American Indians | 0.0 /100 | #307 | Tragic 77.1% |
| Alaska Natives | 0.0 /100 | #308 | Tragic 77.0% |
| Americans | 0.0 /100 | #309 | Tragic 77.0% |
| Comanche | 0.0 /100 | #310 | Tragic 77.0% |
| Blackfeet | 0.0 /100 | #311 | Tragic 77.0% |
| Alaskan Athabascans | 0.0 /100 | #312 | Tragic 76.9% |
| Shoshone | 0.0 /100 | #313 | Tragic 76.8% |
| Blacks/African Americans | 0.0 /100 | #314 | Tragic 76.8% |
| Ottawa | 0.0 /100 | #315 | Tragic 76.7% |
| Yaqui | 0.0 /100 | #316 | Tragic 76.5% |
| Cherokee | 0.0 /100 | #317 | Tragic 76.2% |
| Chickasaw | 0.0 /100 | #318 | Tragic 76.2% |
| Inupiat | 0.0 /100 | #319 | Tragic 76.1% |
| Yakama | 0.0 /100 | #320 | Tragic 75.8% |
| Seminole | 0.0 /100 | #321 | Tragic 75.5% |