Immigrants from China vs Immigrants from France Householder Income Ages 45 - 64 years
COMPARE
Immigrants from China
Immigrants from France
Householder Income Ages 45 - 64 years
Householder Income Ages 45 - 64 years Comparison
Immigrants from China
Immigrants from France
$122,178
HOUSEHOLDER INCOME AGES 45 - 64 YEARS
100.0/ 100
METRIC RATING
16th/ 347
METRIC RANK
$113,680
HOUSEHOLDER INCOME AGES 45 - 64 YEARS
99.9/ 100
METRIC RATING
45th/ 347
METRIC RANK
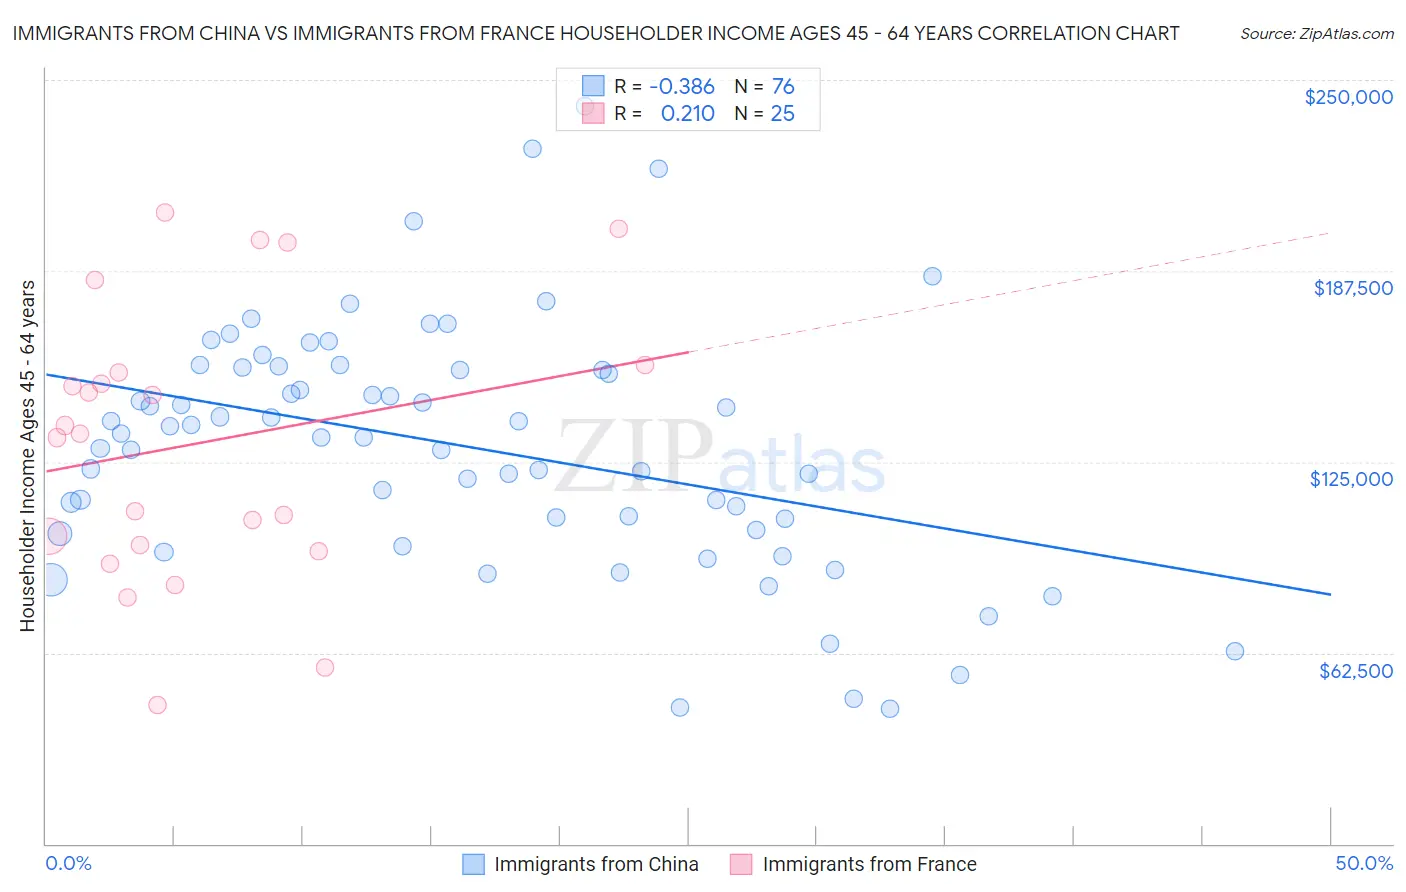
Immigrants from China vs Immigrants from France Householder Income Ages 45 - 64 years Correlation Chart
The statistical analysis conducted on geographies consisting of 455,924,954 people shows a mild negative correlation between the proportion of Immigrants from China and household income with householder between the ages 45 and 64 in the United States with a correlation coefficient (R) of -0.386 and weighted average of $122,178. Similarly, the statistical analysis conducted on geographies consisting of 287,674,634 people shows a weak positive correlation between the proportion of Immigrants from France and household income with householder between the ages 45 and 64 in the United States with a correlation coefficient (R) of 0.210 and weighted average of $113,680, a difference of 7.5%.
Householder Income Ages 45 - 64 years Correlation Summary
| Measurement | Immigrants from China | Immigrants from France |
| Minimum | $44,167 | $45,521 |
| Maximum | $241,602 | $206,746 |
| Range | $197,435 | $161,225 |
| Mean | $130,137 | $130,914 |
| Median | $133,566 | $134,293 |
| Interquartile 25% (IQ1) | $104,536 | $96,696 |
| Interquartile 75% (IQ3) | $155,654 | $155,402 |
| Interquartile Range (IQR) | $51,118 | $58,706 |
| Standard Deviation (Sample) | $40,272 | $45,085 |
| Standard Deviation (Population) | $40,006 | $44,174 |
Similar Demographics by Householder Income Ages 45 - 64 years
Demographics Similar to Immigrants from China by Householder Income Ages 45 - 64 years
In terms of householder income ages 45 - 64 years, the demographic groups most similar to Immigrants from China are Immigrants from Eastern Asia ($122,222, a difference of 0.040%), Indian (Asian) ($122,343, a difference of 0.14%), Immigrants from Ireland ($122,757, a difference of 0.47%), Immigrants from Israel ($122,893, a difference of 0.59%), and Burmese ($121,444, a difference of 0.60%).
| Demographics | Rating | Rank | Householder Income Ages 45 - 64 years |
| Okinawans | 100.0 /100 | #9 | Exceptional $124,796 |
| Immigrants | South Central Asia | 100.0 /100 | #10 | Exceptional $124,188 |
| Cypriots | 100.0 /100 | #11 | Exceptional $123,396 |
| Immigrants | Israel | 100.0 /100 | #12 | Exceptional $122,893 |
| Immigrants | Ireland | 100.0 /100 | #13 | Exceptional $122,757 |
| Indians (Asian) | 100.0 /100 | #14 | Exceptional $122,343 |
| Immigrants | Eastern Asia | 100.0 /100 | #15 | Exceptional $122,222 |
| Immigrants | China | 100.0 /100 | #16 | Exceptional $122,178 |
| Burmese | 100.0 /100 | #17 | Exceptional $121,444 |
| Immigrants | Korea | 100.0 /100 | #18 | Exceptional $121,243 |
| Eastern Europeans | 100.0 /100 | #19 | Exceptional $120,684 |
| Immigrants | Australia | 100.0 /100 | #20 | Exceptional $119,308 |
| Immigrants | Sri Lanka | 100.0 /100 | #21 | Exceptional $119,094 |
| Immigrants | Belgium | 100.0 /100 | #22 | Exceptional $118,932 |
| Bolivians | 100.0 /100 | #23 | Exceptional $118,871 |
Demographics Similar to Immigrants from France by Householder Income Ages 45 - 64 years
In terms of householder income ages 45 - 64 years, the demographic groups most similar to Immigrants from France are Immigrants from Greece ($113,548, a difference of 0.12%), Australian ($113,533, a difference of 0.13%), Immigrants from Indonesia ($113,519, a difference of 0.14%), Bulgarian ($113,883, a difference of 0.18%), and Immigrants from Russia ($113,215, a difference of 0.41%).
| Demographics | Rating | Rank | Householder Income Ages 45 - 64 years |
| Immigrants | Pakistan | 99.9 /100 | #38 | Exceptional $114,434 |
| Immigrants | Turkey | 99.9 /100 | #39 | Exceptional $114,407 |
| Cambodians | 99.9 /100 | #40 | Exceptional $114,342 |
| Immigrants | Lithuania | 99.9 /100 | #41 | Exceptional $114,336 |
| Estonians | 99.9 /100 | #42 | Exceptional $114,220 |
| Israelis | 99.9 /100 | #43 | Exceptional $114,186 |
| Bulgarians | 99.9 /100 | #44 | Exceptional $113,883 |
| Immigrants | France | 99.9 /100 | #45 | Exceptional $113,680 |
| Immigrants | Greece | 99.9 /100 | #46 | Exceptional $113,548 |
| Australians | 99.9 /100 | #47 | Exceptional $113,533 |
| Immigrants | Indonesia | 99.9 /100 | #48 | Exceptional $113,519 |
| Immigrants | Russia | 99.8 /100 | #49 | Exceptional $113,215 |
| Immigrants | Austria | 99.8 /100 | #50 | Exceptional $113,140 |
| Immigrants | South Africa | 99.8 /100 | #51 | Exceptional $112,886 |
| Immigrants | Malaysia | 99.8 /100 | #52 | Exceptional $112,796 |