Immigrants from China vs Immigrants from France Bachelor's Degree
COMPARE
Immigrants from China
Immigrants from France
Bachelor's Degree
Bachelor's Degree Comparison
Immigrants from China
Immigrants from France
48.4%
BACHELOR'S DEGREE
100.0/ 100
METRIC RATING
12th/ 347
METRIC RANK
46.4%
BACHELOR'S DEGREE
100.0/ 100
METRIC RATING
27th/ 347
METRIC RANK
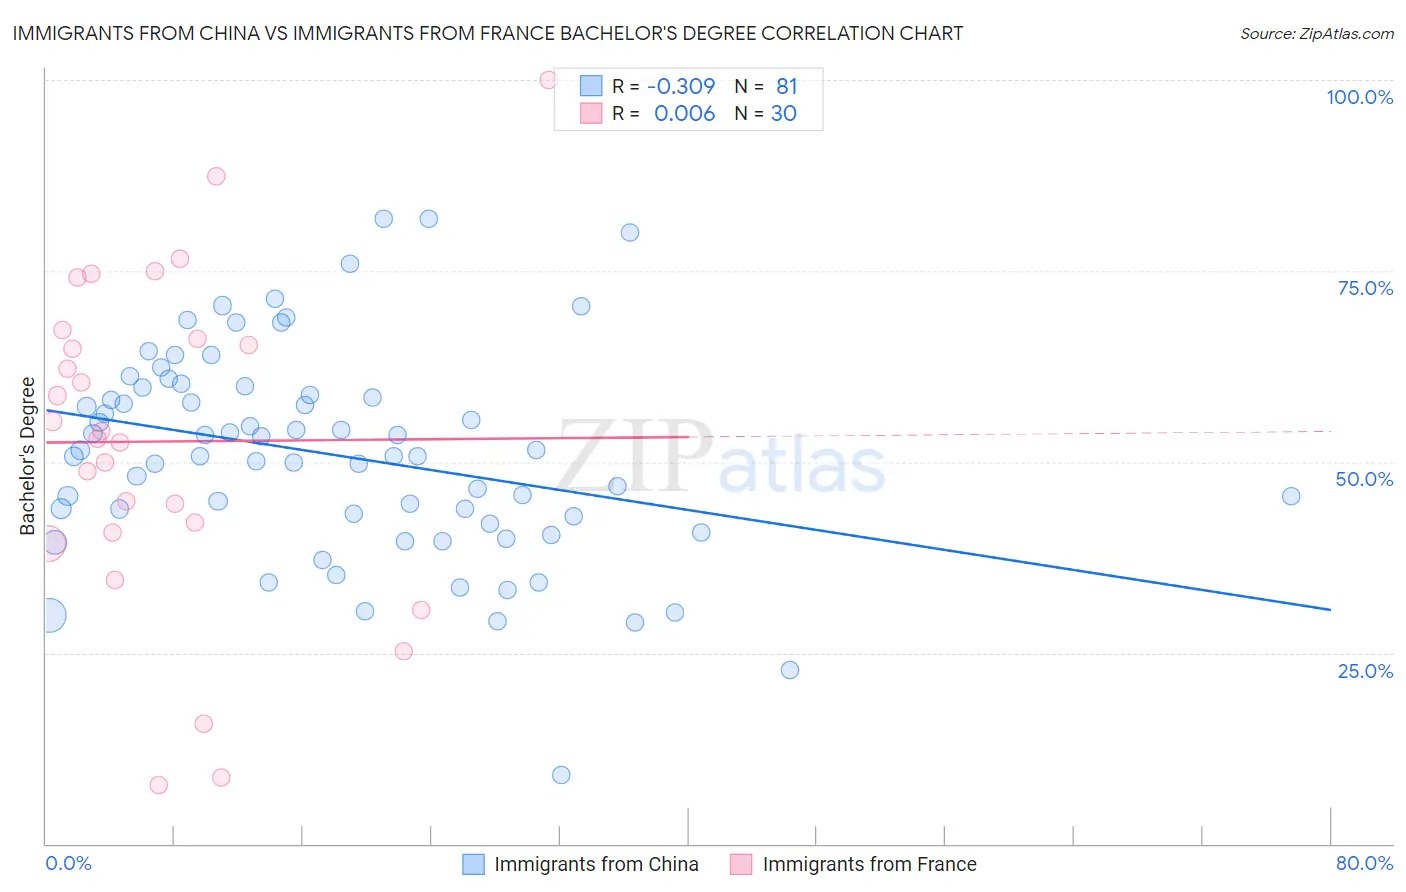
Immigrants from China vs Immigrants from France Bachelor's Degree Correlation Chart
The statistical analysis conducted on geographies consisting of 457,002,044 people shows a mild negative correlation between the proportion of Immigrants from China and percentage of population with at least bachelor's degree education in the United States with a correlation coefficient (R) of -0.309 and weighted average of 48.4%. Similarly, the statistical analysis conducted on geographies consisting of 287,908,561 people shows no correlation between the proportion of Immigrants from France and percentage of population with at least bachelor's degree education in the United States with a correlation coefficient (R) of 0.006 and weighted average of 46.4%, a difference of 4.3%.
Bachelor's Degree Correlation Summary
| Measurement | Immigrants from China | Immigrants from France |
| Minimum | 9.0% | 7.7% |
| Maximum | 81.9% | 100.0% |
| Range | 72.9% | 92.3% |
| Mean | 51.0% | 52.7% |
| Median | 50.8% | 53.5% |
| Interquartile 25% (IQ1) | 42.4% | 40.8% |
| Interquartile 75% (IQ3) | 59.2% | 66.2% |
| Interquartile Range (IQR) | 16.8% | 25.3% |
| Standard Deviation (Sample) | 13.7% | 21.8% |
| Standard Deviation (Population) | 13.7% | 21.5% |
Demographics Similar to Immigrants from China and Immigrants from France by Bachelor's Degree
In terms of bachelor's degree, the demographic groups most similar to Immigrants from China are Immigrants from South Central Asia (48.3%, a difference of 0.14%), Immigrants from Australia (48.5%, a difference of 0.18%), Immigrants from Hong Kong (48.2%, a difference of 0.42%), Immigrants from Eastern Asia (48.1%, a difference of 0.56%), and Soviet Union (47.9%, a difference of 1.0%). Similarly, the demographic groups most similar to Immigrants from France are Turkish (46.2%, a difference of 0.46%), Israeli (46.1%, a difference of 0.59%), Immigrants from Japan (46.8%, a difference of 0.91%), Burmese (46.9%, a difference of 1.0%), and Immigrants from Korea (47.0%, a difference of 1.2%).
| Demographics | Rating | Rank | Bachelor's Degree |
| Immigrants | Israel | 100.0 /100 | #9 | Exceptional 50.0% |
| Cypriots | 100.0 /100 | #10 | Exceptional 49.0% |
| Immigrants | Australia | 100.0 /100 | #11 | Exceptional 48.5% |
| Immigrants | China | 100.0 /100 | #12 | Exceptional 48.4% |
| Immigrants | South Central Asia | 100.0 /100 | #13 | Exceptional 48.3% |
| Immigrants | Hong Kong | 100.0 /100 | #14 | Exceptional 48.2% |
| Immigrants | Eastern Asia | 100.0 /100 | #15 | Exceptional 48.1% |
| Soviet Union | 100.0 /100 | #16 | Exceptional 47.9% |
| Eastern Europeans | 100.0 /100 | #17 | Exceptional 47.5% |
| Indians (Asian) | 100.0 /100 | #18 | Exceptional 47.4% |
| Cambodians | 100.0 /100 | #19 | Exceptional 47.2% |
| Immigrants | Switzerland | 100.0 /100 | #20 | Exceptional 47.1% |
| Immigrants | Ireland | 100.0 /100 | #21 | Exceptional 47.1% |
| Immigrants | Belgium | 100.0 /100 | #22 | Exceptional 47.0% |
| Immigrants | Sweden | 100.0 /100 | #23 | Exceptional 47.0% |
| Immigrants | Korea | 100.0 /100 | #24 | Exceptional 47.0% |
| Burmese | 100.0 /100 | #25 | Exceptional 46.9% |
| Immigrants | Japan | 100.0 /100 | #26 | Exceptional 46.8% |
| Immigrants | France | 100.0 /100 | #27 | Exceptional 46.4% |
| Turks | 100.0 /100 | #28 | Exceptional 46.2% |
| Israelis | 100.0 /100 | #29 | Exceptional 46.1% |