Jamaican vs Salvadoran In Labor Force | Age > 16
COMPARE
Jamaican
Salvadoran
In Labor Force | Age > 16
In Labor Force | Age > 16 Comparison
Jamaicans
Salvadorans
64.9%
IN LABOR FORCE | AGE > 16
18.7/ 100
METRIC RATING
205th/ 347
METRIC RANK
66.8%
IN LABOR FORCE | AGE > 16
100.0/ 100
METRIC RATING
39th/ 347
METRIC RANK
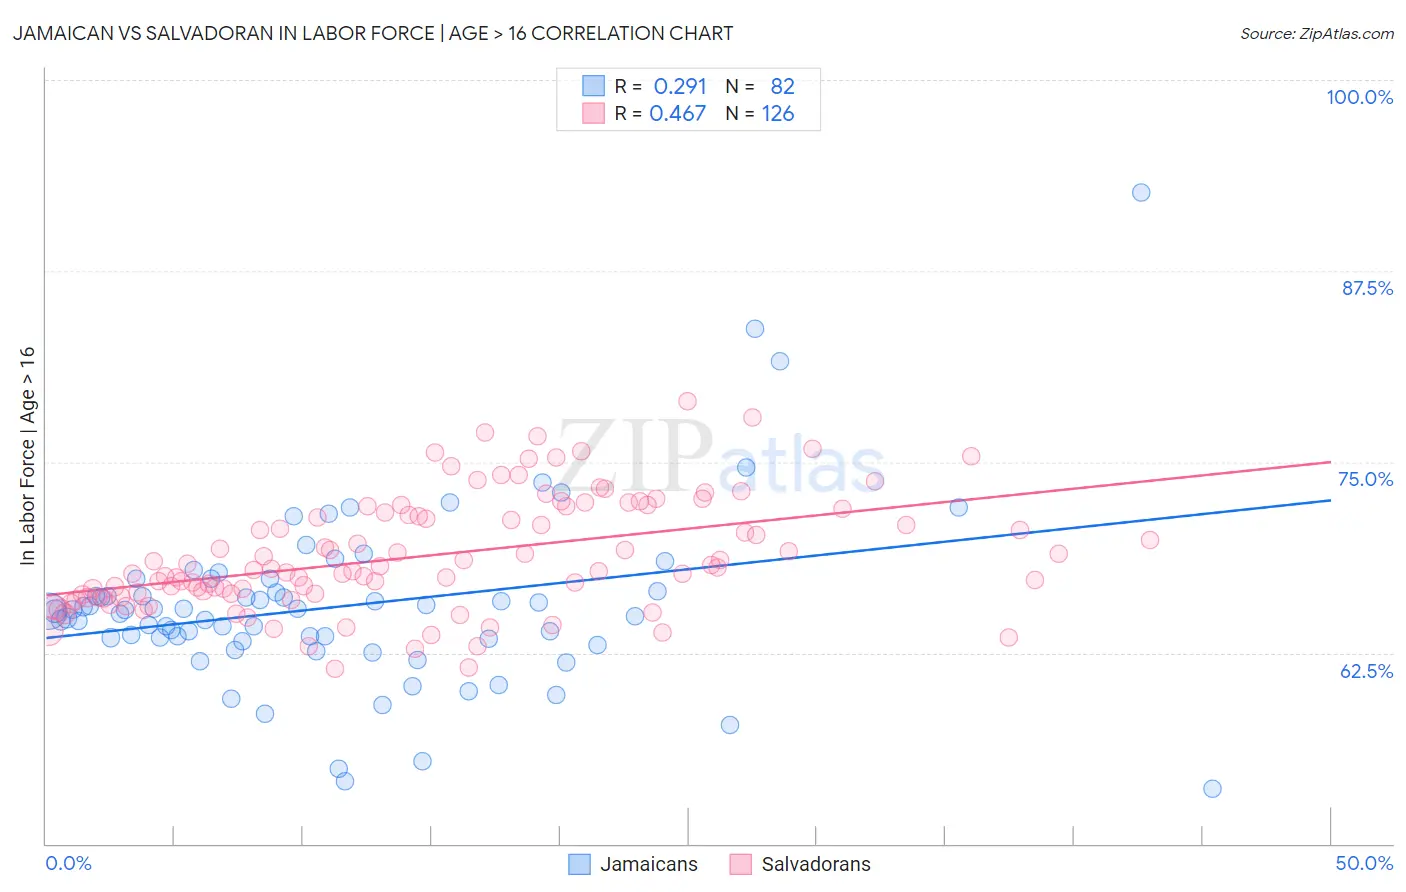
Jamaican vs Salvadoran In Labor Force | Age > 16 Correlation Chart
The statistical analysis conducted on geographies consisting of 368,080,959 people shows a weak positive correlation between the proportion of Jamaicans and labor force participation rate among population ages 16 and over in the United States with a correlation coefficient (R) of 0.291 and weighted average of 64.9%. Similarly, the statistical analysis conducted on geographies consisting of 399,019,559 people shows a moderate positive correlation between the proportion of Salvadorans and labor force participation rate among population ages 16 and over in the United States with a correlation coefficient (R) of 0.467 and weighted average of 66.8%, a difference of 3.0%.
In Labor Force | Age > 16 Correlation Summary
| Measurement | Jamaican | Salvadoran |
| Minimum | 53.6% | 61.5% |
| Maximum | 92.6% | 79.0% |
| Range | 39.0% | 17.5% |
| Mean | 65.5% | 68.9% |
| Median | 65.2% | 67.9% |
| Interquartile 25% (IQ1) | 63.4% | 66.3% |
| Interquartile 75% (IQ3) | 66.5% | 71.7% |
| Interquartile Range (IQR) | 3.1% | 5.4% |
| Standard Deviation (Sample) | 5.8% | 3.7% |
| Standard Deviation (Population) | 5.8% | 3.7% |
Similar Demographics by In Labor Force | Age > 16
Demographics Similar to Jamaicans by In Labor Force | Age > 16
In terms of in labor force | age > 16, the demographic groups most similar to Jamaicans are Russian (64.9%, a difference of 0.0%), Slovene (64.9%, a difference of 0.0%), Immigrants from Belgium (64.9%, a difference of 0.010%), Ukrainian (64.9%, a difference of 0.020%), and Armenian (64.9%, a difference of 0.030%).
| Demographics | Rating | Rank | In Labor Force | Age > 16 |
| Greeks | 26.1 /100 | #198 | Fair 64.9% |
| Mexican American Indians | 23.1 /100 | #199 | Fair 64.9% |
| Armenians | 20.2 /100 | #200 | Fair 64.9% |
| Ukrainians | 19.6 /100 | #201 | Poor 64.9% |
| Immigrants | Belgium | 19.4 /100 | #202 | Poor 64.9% |
| Russians | 18.8 /100 | #203 | Poor 64.9% |
| Slovenes | 18.7 /100 | #204 | Poor 64.9% |
| Jamaicans | 18.7 /100 | #205 | Poor 64.9% |
| Lithuanians | 17.4 /100 | #206 | Poor 64.8% |
| Immigrants | Latin America | 16.4 /100 | #207 | Poor 64.8% |
| Belizeans | 16.2 /100 | #208 | Poor 64.8% |
| Immigrants | Trinidad and Tobago | 15.6 /100 | #209 | Poor 64.8% |
| Immigrants | Denmark | 14.7 /100 | #210 | Poor 64.8% |
| Fijians | 14.1 /100 | #211 | Poor 64.8% |
| Alaskan Athabascans | 13.9 /100 | #212 | Poor 64.8% |
Demographics Similar to Salvadorans by In Labor Force | Age > 16
In terms of in labor force | age > 16, the demographic groups most similar to Salvadorans are Immigrants from El Salvador (66.8%, a difference of 0.020%), Immigrants from Zimbabwe (66.8%, a difference of 0.020%), Senegalese (66.7%, a difference of 0.11%), Luxembourger (66.7%, a difference of 0.14%), and Immigrants from Nigeria (66.9%, a difference of 0.16%).
| Demographics | Rating | Rank | In Labor Force | Age > 16 |
| Immigrants | Congo | 100.0 /100 | #32 | Exceptional 67.1% |
| Afghans | 100.0 /100 | #33 | Exceptional 67.1% |
| Immigrants | Ghana | 100.0 /100 | #34 | Exceptional 67.1% |
| Immigrants | South Central Asia | 100.0 /100 | #35 | Exceptional 67.1% |
| Immigrants | Western Africa | 100.0 /100 | #36 | Exceptional 67.1% |
| Immigrants | Afghanistan | 100.0 /100 | #37 | Exceptional 67.0% |
| Immigrants | Nigeria | 100.0 /100 | #38 | Exceptional 66.9% |
| Salvadorans | 100.0 /100 | #39 | Exceptional 66.8% |
| Immigrants | El Salvador | 100.0 /100 | #40 | Exceptional 66.8% |
| Immigrants | Zimbabwe | 100.0 /100 | #41 | Exceptional 66.8% |
| Senegalese | 100.0 /100 | #42 | Exceptional 66.7% |
| Luxembourgers | 100.0 /100 | #43 | Exceptional 66.7% |
| Immigrants | Pakistan | 100.0 /100 | #44 | Exceptional 66.7% |
| Immigrants | Brazil | 100.0 /100 | #45 | Exceptional 66.7% |
| Brazilians | 100.0 /100 | #46 | Exceptional 66.6% |