Immigrants from Germany vs Bolivian In Labor Force | Age 16-19
COMPARE
Immigrants from Germany
Bolivian
In Labor Force | Age 16-19
In Labor Force | Age 16-19 Comparison
Immigrants from Germany
Bolivians
39.1%
IN LABOR FORCE | AGE 16-19
99.6/ 100
METRIC RATING
87th/ 347
METRIC RANK
36.0%
IN LABOR FORCE | AGE 16-19
23.3/ 100
METRIC RATING
195th/ 347
METRIC RANK
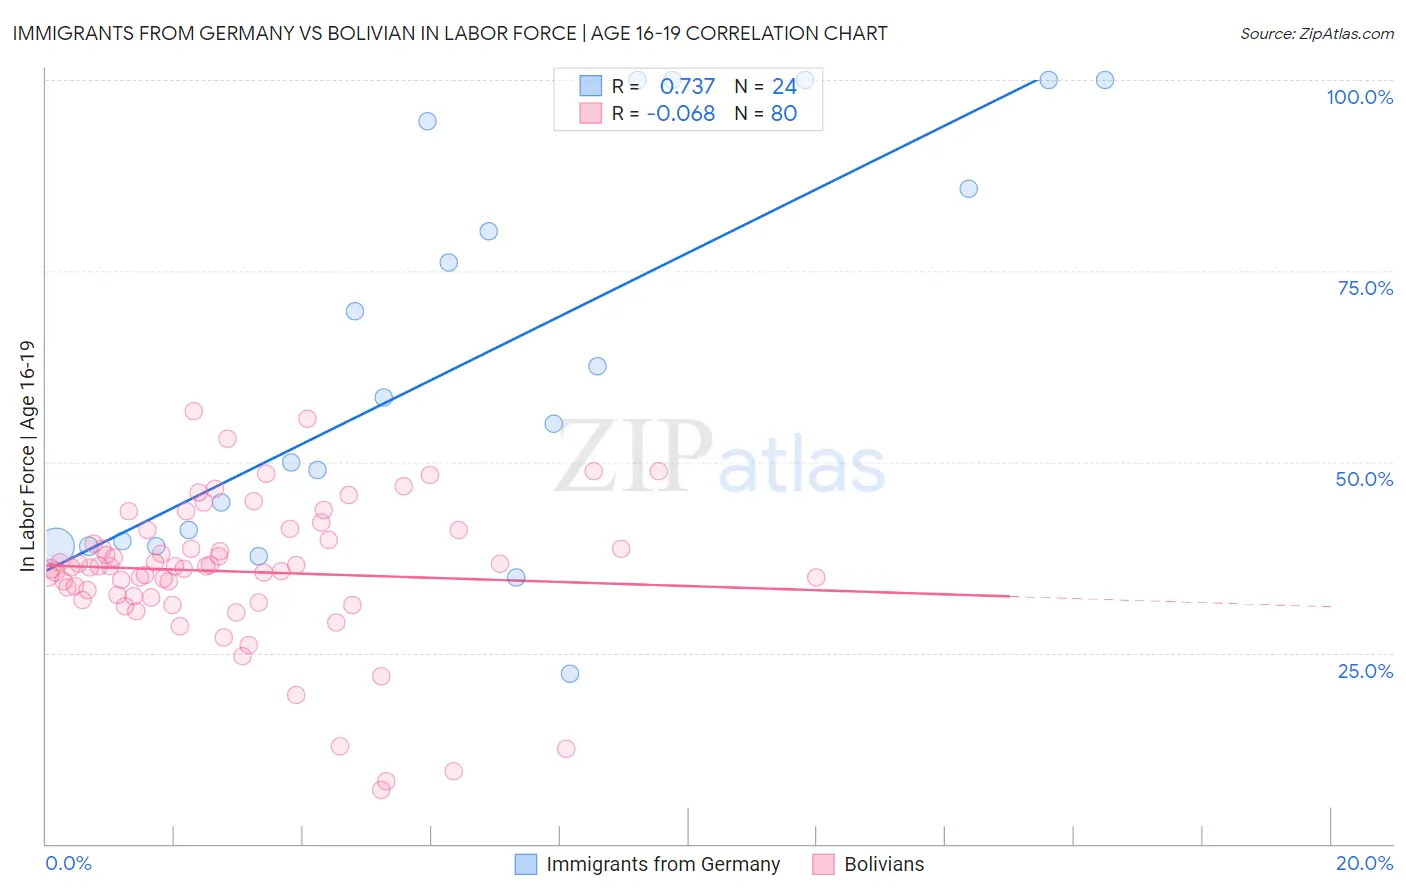
Immigrants from Germany vs Bolivian In Labor Force | Age 16-19 Correlation Chart
The statistical analysis conducted on geographies consisting of 462,642,195 people shows a strong positive correlation between the proportion of Immigrants from Germany and labor force participation rate among population between the ages 16 and 19 in the United States with a correlation coefficient (R) of 0.737 and weighted average of 39.1%. Similarly, the statistical analysis conducted on geographies consisting of 184,559,639 people shows a slight negative correlation between the proportion of Bolivians and labor force participation rate among population between the ages 16 and 19 in the United States with a correlation coefficient (R) of -0.068 and weighted average of 36.0%, a difference of 8.6%.
In Labor Force | Age 16-19 Correlation Summary
| Measurement | Immigrants from Germany | Bolivian |
| Minimum | 22.2% | 7.1% |
| Maximum | 100.0% | 56.7% |
| Range | 77.8% | 49.6% |
| Mean | 63.2% | 35.6% |
| Median | 56.7% | 36.3% |
| Interquartile 25% (IQ1) | 39.3% | 32.3% |
| Interquartile 75% (IQ3) | 90.1% | 40.4% |
| Interquartile Range (IQR) | 50.8% | 8.1% |
| Standard Deviation (Sample) | 26.0% | 9.5% |
| Standard Deviation (Population) | 25.4% | 9.5% |
Similar Demographics by In Labor Force | Age 16-19
Demographics Similar to Immigrants from Germany by In Labor Force | Age 16-19
In terms of in labor force | age 16-19, the demographic groups most similar to Immigrants from Germany are Puget Sound Salish (39.1%, a difference of 0.070%), Samoan (39.1%, a difference of 0.080%), Alaska Native (39.1%, a difference of 0.080%), Creek (39.1%, a difference of 0.10%), and Immigrants from Burma/Myanmar (39.0%, a difference of 0.16%).
| Demographics | Rating | Rank | In Labor Force | Age 16-19 |
| Immigrants | Iraq | 99.8 /100 | #80 | Exceptional 39.4% |
| Shoshone | 99.7 /100 | #81 | Exceptional 39.3% |
| Basques | 99.7 /100 | #82 | Exceptional 39.3% |
| Spanish | 99.7 /100 | #83 | Exceptional 39.3% |
| Immigrants | Uganda | 99.7 /100 | #84 | Exceptional 39.2% |
| Creek | 99.6 /100 | #85 | Exceptional 39.1% |
| Samoans | 99.6 /100 | #86 | Exceptional 39.1% |
| Immigrants | Germany | 99.6 /100 | #87 | Exceptional 39.1% |
| Puget Sound Salish | 99.6 /100 | #88 | Exceptional 39.1% |
| Alaska Natives | 99.6 /100 | #89 | Exceptional 39.1% |
| Immigrants | Burma/Myanmar | 99.5 /100 | #90 | Exceptional 39.0% |
| Spanish Americans | 99.5 /100 | #91 | Exceptional 39.0% |
| Osage | 99.4 /100 | #92 | Exceptional 39.0% |
| Blackfeet | 99.4 /100 | #93 | Exceptional 38.9% |
| Immigrants | Canada | 99.4 /100 | #94 | Exceptional 38.9% |
Demographics Similar to Bolivians by In Labor Force | Age 16-19
In terms of in labor force | age 16-19, the demographic groups most similar to Bolivians are Nigerian (36.1%, a difference of 0.090%), Immigrants from Denmark (36.1%, a difference of 0.12%), Afghan (36.1%, a difference of 0.16%), Mexican American Indian (36.0%, a difference of 0.16%), and Immigrants from Serbia (36.0%, a difference of 0.17%).
| Demographics | Rating | Rank | In Labor Force | Age 16-19 |
| Immigrants | Europe | 31.8 /100 | #188 | Fair 36.2% |
| Immigrants | Hungary | 28.8 /100 | #189 | Fair 36.2% |
| Panamanians | 28.6 /100 | #190 | Fair 36.1% |
| Immigrants | Croatia | 27.5 /100 | #191 | Fair 36.1% |
| Afghans | 25.7 /100 | #192 | Fair 36.1% |
| Immigrants | Denmark | 25.0 /100 | #193 | Fair 36.1% |
| Nigerians | 24.6 /100 | #194 | Fair 36.1% |
| Bolivians | 23.3 /100 | #195 | Fair 36.0% |
| Mexican American Indians | 21.1 /100 | #196 | Fair 36.0% |
| Immigrants | Serbia | 21.0 /100 | #197 | Fair 36.0% |
| Immigrants | Northern Africa | 19.9 /100 | #198 | Poor 35.9% |
| Immigrants | Norway | 19.8 /100 | #199 | Poor 35.9% |
| Immigrants | Sweden | 18.8 /100 | #200 | Poor 35.9% |
| Alsatians | 17.5 /100 | #201 | Poor 35.9% |
| Senegalese | 17.4 /100 | #202 | Poor 35.9% |