Immigrants from Cambodia vs Bolivian In Labor Force | Age 16-19
COMPARE
Immigrants from Cambodia
Bolivian
In Labor Force | Age 16-19
In Labor Force | Age 16-19 Comparison
Immigrants from Cambodia
Bolivians
36.7%
IN LABOR FORCE | AGE 16-19
58.4/ 100
METRIC RATING
171st/ 347
METRIC RANK
36.0%
IN LABOR FORCE | AGE 16-19
23.3/ 100
METRIC RATING
195th/ 347
METRIC RANK
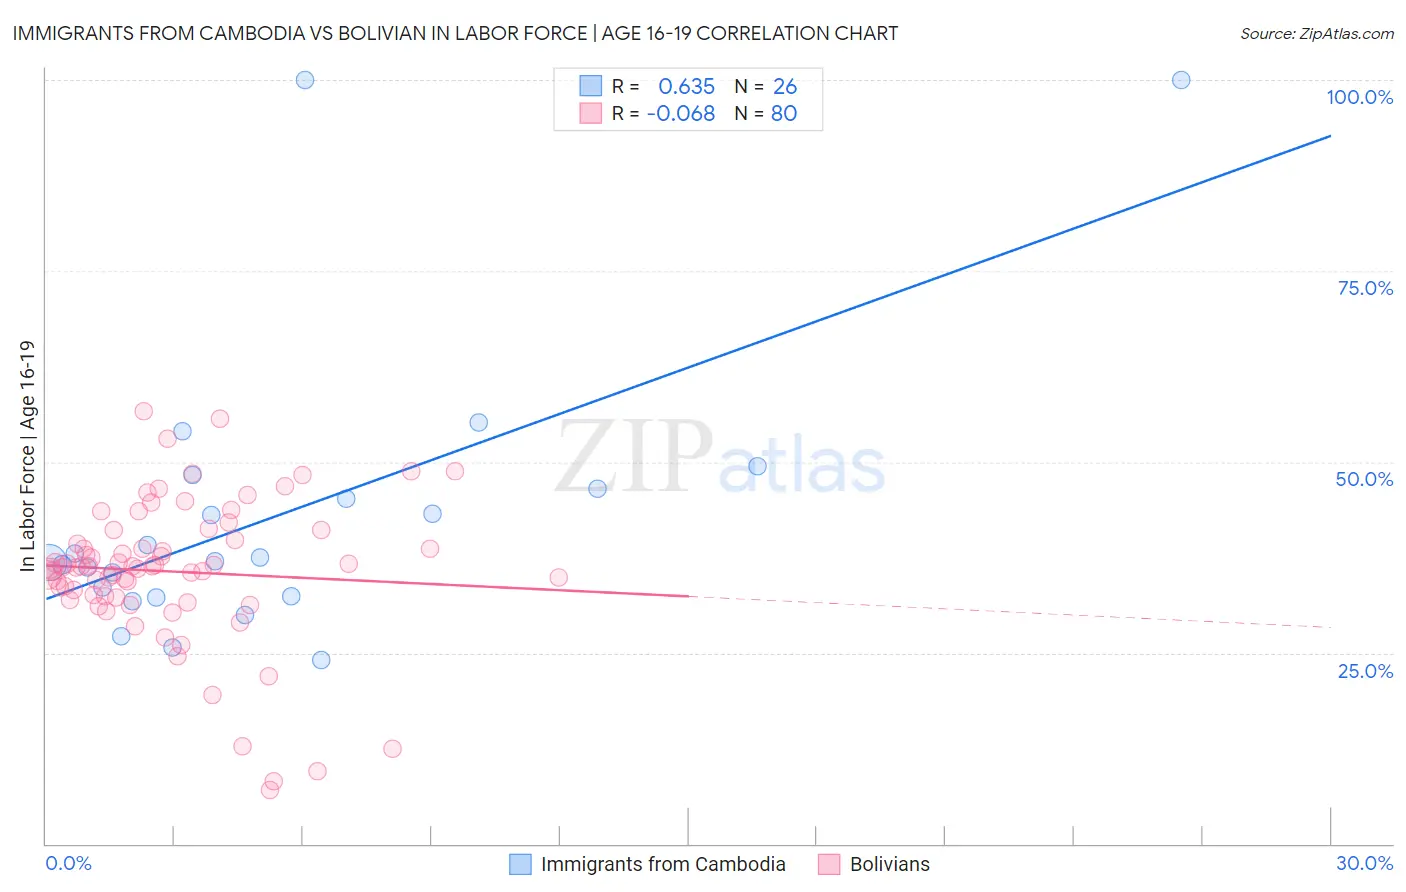
Immigrants from Cambodia vs Bolivian In Labor Force | Age 16-19 Correlation Chart
The statistical analysis conducted on geographies consisting of 205,098,821 people shows a significant positive correlation between the proportion of Immigrants from Cambodia and labor force participation rate among population between the ages 16 and 19 in the United States with a correlation coefficient (R) of 0.635 and weighted average of 36.7%. Similarly, the statistical analysis conducted on geographies consisting of 184,559,639 people shows a slight negative correlation between the proportion of Bolivians and labor force participation rate among population between the ages 16 and 19 in the United States with a correlation coefficient (R) of -0.068 and weighted average of 36.0%, a difference of 1.9%.
In Labor Force | Age 16-19 Correlation Summary
| Measurement | Immigrants from Cambodia | Bolivian |
| Minimum | 24.1% | 7.1% |
| Maximum | 100.0% | 56.7% |
| Range | 75.9% | 49.6% |
| Mean | 43.0% | 35.6% |
| Median | 37.2% | 36.3% |
| Interquartile 25% (IQ1) | 32.5% | 32.3% |
| Interquartile 75% (IQ3) | 46.4% | 40.4% |
| Interquartile Range (IQR) | 13.9% | 8.1% |
| Standard Deviation (Sample) | 18.6% | 9.5% |
| Standard Deviation (Population) | 18.3% | 9.5% |
Similar Demographics by In Labor Force | Age 16-19
Demographics Similar to Immigrants from Cambodia by In Labor Force | Age 16-19
In terms of in labor force | age 16-19, the demographic groups most similar to Immigrants from Cambodia are South African (36.7%, a difference of 0.010%), Russian (36.7%, a difference of 0.040%), Immigrants from South Africa (36.8%, a difference of 0.11%), Immigrants from Latvia (36.8%, a difference of 0.17%), and Palestinian (36.8%, a difference of 0.25%).
| Demographics | Rating | Rank | In Labor Force | Age 16-19 |
| Immigrants | Kuwait | 68.9 /100 | #164 | Good 36.9% |
| Yakama | 66.9 /100 | #165 | Good 36.9% |
| Immigrants | Western Africa | 66.7 /100 | #166 | Good 36.9% |
| Arabs | 63.6 /100 | #167 | Good 36.8% |
| Palestinians | 63.1 /100 | #168 | Good 36.8% |
| Immigrants | Latvia | 61.6 /100 | #169 | Good 36.8% |
| Immigrants | South Africa | 60.5 /100 | #170 | Good 36.8% |
| Immigrants | Cambodia | 58.4 /100 | #171 | Average 36.7% |
| South Africans | 58.3 /100 | #172 | Average 36.7% |
| Russians | 57.5 /100 | #173 | Average 36.7% |
| Immigrants | Czechoslovakia | 50.0 /100 | #174 | Average 36.6% |
| Natives/Alaskans | 49.0 /100 | #175 | Average 36.6% |
| Albanians | 48.8 /100 | #176 | Average 36.5% |
| Immigrants | Northern Europe | 46.6 /100 | #177 | Average 36.5% |
| Blacks/African Americans | 45.1 /100 | #178 | Average 36.5% |
Demographics Similar to Bolivians by In Labor Force | Age 16-19
In terms of in labor force | age 16-19, the demographic groups most similar to Bolivians are Nigerian (36.1%, a difference of 0.090%), Immigrants from Denmark (36.1%, a difference of 0.12%), Afghan (36.1%, a difference of 0.16%), Mexican American Indian (36.0%, a difference of 0.16%), and Immigrants from Serbia (36.0%, a difference of 0.17%).
| Demographics | Rating | Rank | In Labor Force | Age 16-19 |
| Immigrants | Europe | 31.8 /100 | #188 | Fair 36.2% |
| Immigrants | Hungary | 28.8 /100 | #189 | Fair 36.2% |
| Panamanians | 28.6 /100 | #190 | Fair 36.1% |
| Immigrants | Croatia | 27.5 /100 | #191 | Fair 36.1% |
| Afghans | 25.7 /100 | #192 | Fair 36.1% |
| Immigrants | Denmark | 25.0 /100 | #193 | Fair 36.1% |
| Nigerians | 24.6 /100 | #194 | Fair 36.1% |
| Bolivians | 23.3 /100 | #195 | Fair 36.0% |
| Mexican American Indians | 21.1 /100 | #196 | Fair 36.0% |
| Immigrants | Serbia | 21.0 /100 | #197 | Fair 36.0% |
| Immigrants | Northern Africa | 19.9 /100 | #198 | Poor 35.9% |
| Immigrants | Norway | 19.8 /100 | #199 | Poor 35.9% |
| Immigrants | Sweden | 18.8 /100 | #200 | Poor 35.9% |
| Alsatians | 17.5 /100 | #201 | Poor 35.9% |
| Senegalese | 17.4 /100 | #202 | Poor 35.9% |