Choctaw vs Bolivian In Labor Force | Age 16-19
COMPARE
Choctaw
Bolivian
In Labor Force | Age 16-19
In Labor Force | Age 16-19 Comparison
Choctaw
Bolivians
38.0%
IN LABOR FORCE | AGE 16-19
95.6/ 100
METRIC RATING
127th/ 347
METRIC RANK
36.0%
IN LABOR FORCE | AGE 16-19
23.3/ 100
METRIC RATING
195th/ 347
METRIC RANK
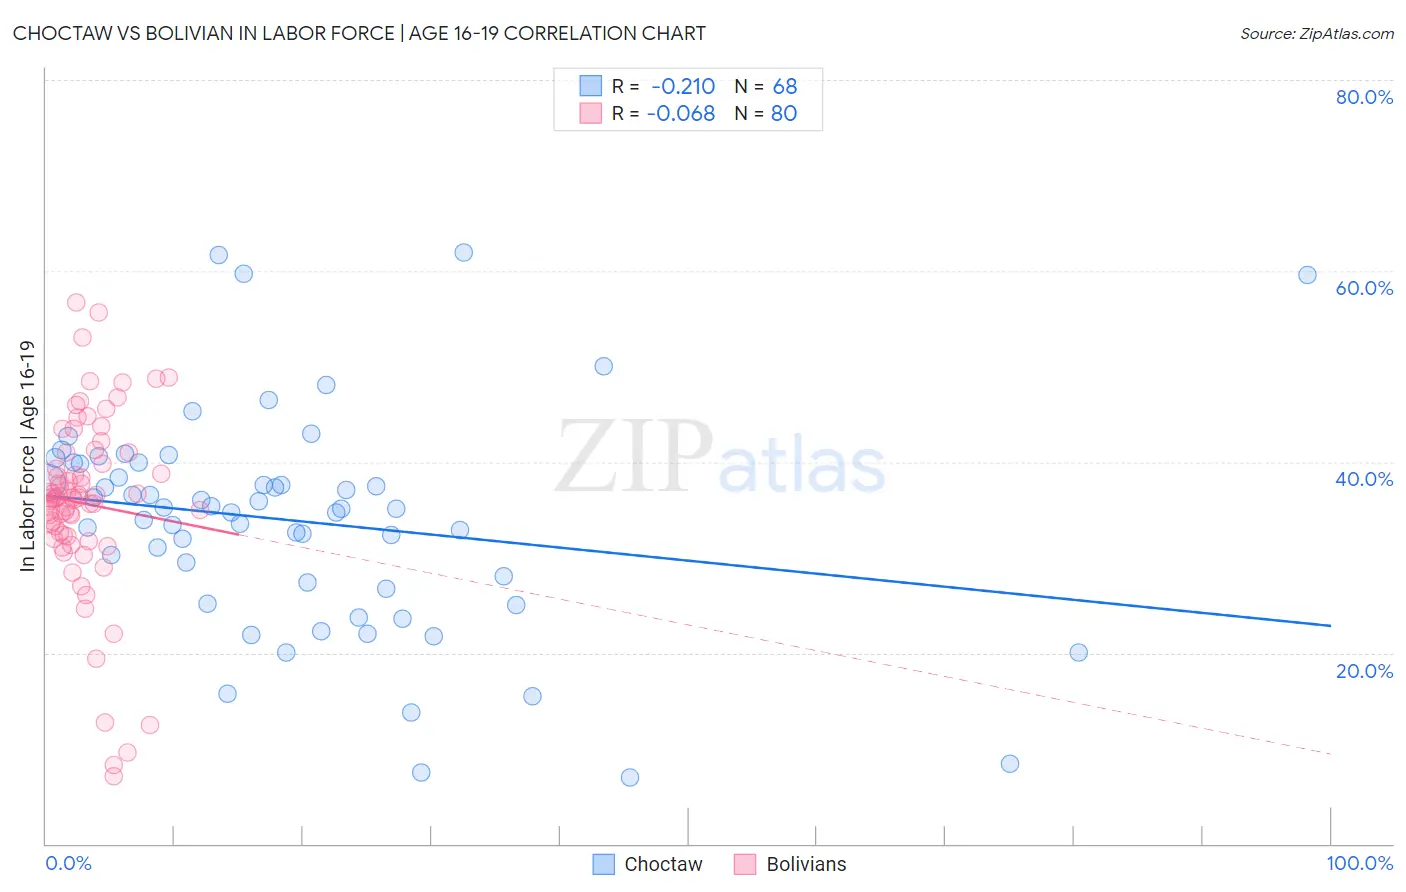
Choctaw vs Bolivian In Labor Force | Age 16-19 Correlation Chart
The statistical analysis conducted on geographies consisting of 269,371,385 people shows a weak negative correlation between the proportion of Choctaw and labor force participation rate among population between the ages 16 and 19 in the United States with a correlation coefficient (R) of -0.210 and weighted average of 38.0%. Similarly, the statistical analysis conducted on geographies consisting of 184,559,639 people shows a slight negative correlation between the proportion of Bolivians and labor force participation rate among population between the ages 16 and 19 in the United States with a correlation coefficient (R) of -0.068 and weighted average of 36.0%, a difference of 5.4%.
In Labor Force | Age 16-19 Correlation Summary
| Measurement | Choctaw | Bolivian |
| Minimum | 6.9% | 7.1% |
| Maximum | 61.9% | 56.7% |
| Range | 55.0% | 49.6% |
| Mean | 33.8% | 35.6% |
| Median | 35.1% | 36.3% |
| Interquartile 25% (IQ1) | 27.0% | 32.3% |
| Interquartile 75% (IQ3) | 39.9% | 40.4% |
| Interquartile Range (IQR) | 12.8% | 8.1% |
| Standard Deviation (Sample) | 11.5% | 9.5% |
| Standard Deviation (Population) | 11.5% | 9.5% |
Similar Demographics by In Labor Force | Age 16-19
Demographics Similar to Choctaw by In Labor Force | Age 16-19
In terms of in labor force | age 16-19, the demographic groups most similar to Choctaw are New Zealander (38.0%, a difference of 0.0%), African (38.0%, a difference of 0.010%), Spaniard (38.0%, a difference of 0.030%), Immigrants from Zimbabwe (38.0%, a difference of 0.060%), and Immigrants from Austria (37.9%, a difference of 0.15%).
| Demographics | Rating | Rank | In Labor Force | Age 16-19 |
| Ukrainians | 97.6 /100 | #120 | Exceptional 38.3% |
| Ethiopians | 97.4 /100 | #121 | Exceptional 38.2% |
| Guamanians/Chamorros | 97.4 /100 | #122 | Exceptional 38.2% |
| Seminole | 96.7 /100 | #123 | Exceptional 38.1% |
| Immigrants | England | 96.4 /100 | #124 | Exceptional 38.1% |
| Immigrants | Africa | 96.1 /100 | #125 | Exceptional 38.0% |
| Africans | 95.6 /100 | #126 | Exceptional 38.0% |
| Choctaw | 95.6 /100 | #127 | Exceptional 38.0% |
| New Zealanders | 95.6 /100 | #128 | Exceptional 38.0% |
| Spaniards | 95.5 /100 | #129 | Exceptional 38.0% |
| Immigrants | Zimbabwe | 95.4 /100 | #130 | Exceptional 38.0% |
| Immigrants | Austria | 95.0 /100 | #131 | Exceptional 37.9% |
| Immigrants | Oceania | 94.7 /100 | #132 | Exceptional 37.9% |
| Cheyenne | 94.6 /100 | #133 | Exceptional 37.9% |
| Immigrants | Netherlands | 93.7 /100 | #134 | Exceptional 37.8% |
Demographics Similar to Bolivians by In Labor Force | Age 16-19
In terms of in labor force | age 16-19, the demographic groups most similar to Bolivians are Nigerian (36.1%, a difference of 0.090%), Immigrants from Denmark (36.1%, a difference of 0.12%), Afghan (36.1%, a difference of 0.16%), Mexican American Indian (36.0%, a difference of 0.16%), and Immigrants from Serbia (36.0%, a difference of 0.17%).
| Demographics | Rating | Rank | In Labor Force | Age 16-19 |
| Immigrants | Europe | 31.8 /100 | #188 | Fair 36.2% |
| Immigrants | Hungary | 28.8 /100 | #189 | Fair 36.2% |
| Panamanians | 28.6 /100 | #190 | Fair 36.1% |
| Immigrants | Croatia | 27.5 /100 | #191 | Fair 36.1% |
| Afghans | 25.7 /100 | #192 | Fair 36.1% |
| Immigrants | Denmark | 25.0 /100 | #193 | Fair 36.1% |
| Nigerians | 24.6 /100 | #194 | Fair 36.1% |
| Bolivians | 23.3 /100 | #195 | Fair 36.0% |
| Mexican American Indians | 21.1 /100 | #196 | Fair 36.0% |
| Immigrants | Serbia | 21.0 /100 | #197 | Fair 36.0% |
| Immigrants | Northern Africa | 19.9 /100 | #198 | Poor 35.9% |
| Immigrants | Norway | 19.8 /100 | #199 | Poor 35.9% |
| Immigrants | Sweden | 18.8 /100 | #200 | Poor 35.9% |
| Alsatians | 17.5 /100 | #201 | Poor 35.9% |
| Senegalese | 17.4 /100 | #202 | Poor 35.9% |