Immigrants from Caribbean vs Moroccan In Labor Force | Age 16-19
COMPARE
Immigrants from Caribbean
Moroccan
In Labor Force | Age 16-19
In Labor Force | Age 16-19 Comparison
Immigrants from Caribbean
Moroccans
31.2%
IN LABOR FORCE | AGE 16-19
0.0/ 100
METRIC RATING
323rd/ 347
METRIC RANK
35.7%
IN LABOR FORCE | AGE 16-19
12.7/ 100
METRIC RATING
209th/ 347
METRIC RANK
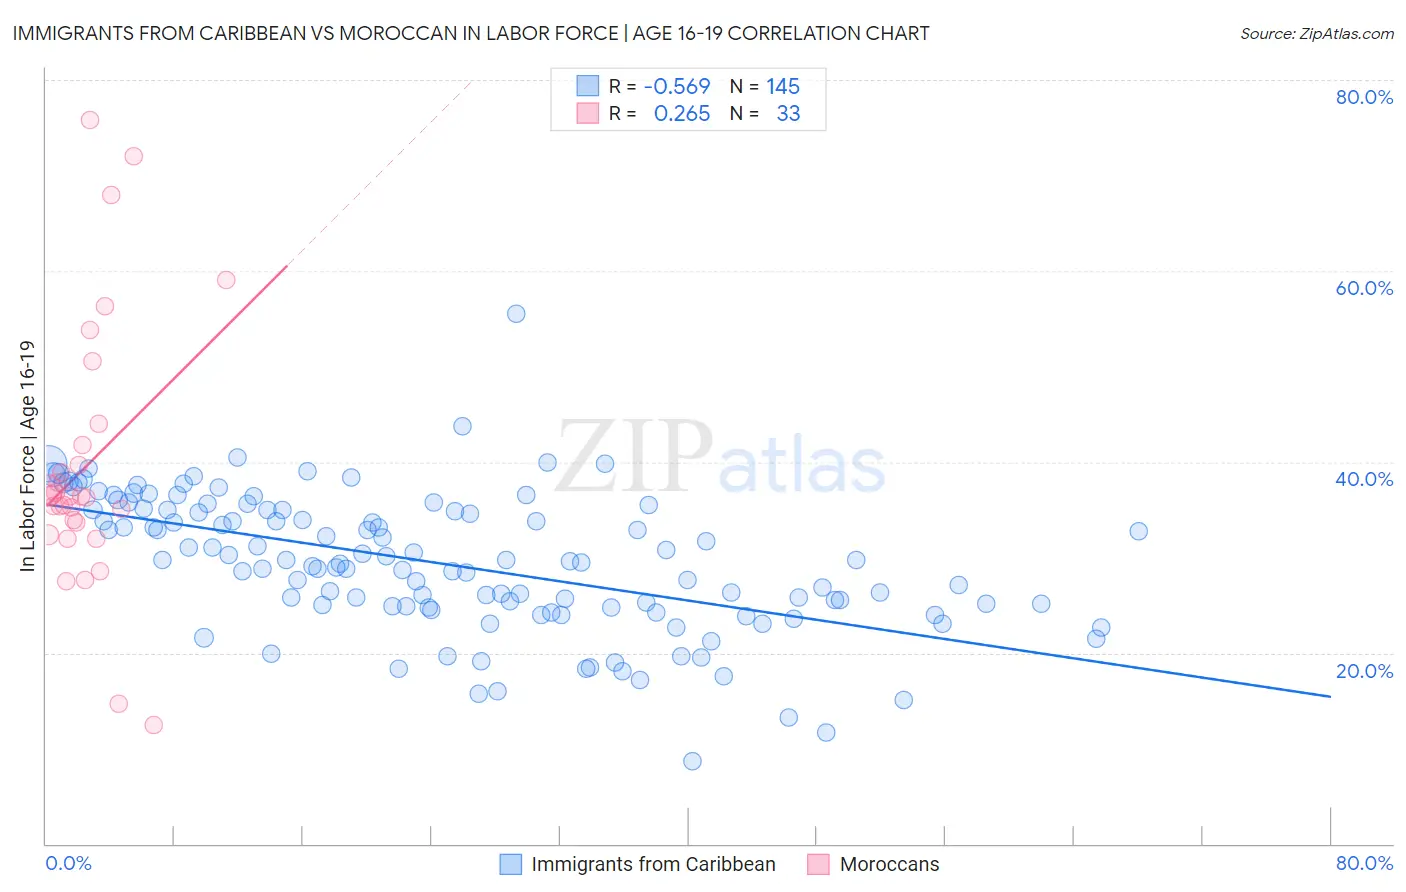
Immigrants from Caribbean vs Moroccan In Labor Force | Age 16-19 Correlation Chart
The statistical analysis conducted on geographies consisting of 448,967,505 people shows a substantial negative correlation between the proportion of Immigrants from Caribbean and labor force participation rate among population between the ages 16 and 19 in the United States with a correlation coefficient (R) of -0.569 and weighted average of 31.2%. Similarly, the statistical analysis conducted on geographies consisting of 201,678,559 people shows a weak positive correlation between the proportion of Moroccans and labor force participation rate among population between the ages 16 and 19 in the United States with a correlation coefficient (R) of 0.265 and weighted average of 35.7%, a difference of 14.2%.
In Labor Force | Age 16-19 Correlation Summary
| Measurement | Immigrants from Caribbean | Moroccan |
| Minimum | 8.6% | 12.5% |
| Maximum | 55.5% | 75.8% |
| Range | 46.9% | 63.3% |
| Mean | 29.4% | 39.6% |
| Median | 29.6% | 36.4% |
| Interquartile 25% (IQ1) | 24.8% | 33.0% |
| Interquartile 75% (IQ3) | 35.0% | 42.9% |
| Interquartile Range (IQR) | 10.1% | 9.9% |
| Standard Deviation (Sample) | 7.2% | 14.1% |
| Standard Deviation (Population) | 7.2% | 13.8% |
Similar Demographics by In Labor Force | Age 16-19
Demographics Similar to Immigrants from Caribbean by In Labor Force | Age 16-19
In terms of in labor force | age 16-19, the demographic groups most similar to Immigrants from Caribbean are Tohono O'odham (31.3%, a difference of 0.13%), Dominican (31.2%, a difference of 0.18%), West Indian (31.3%, a difference of 0.25%), Immigrants from China (31.1%, a difference of 0.33%), and Ecuadorian (31.4%, a difference of 0.48%).
| Demographics | Rating | Rank | In Labor Force | Age 16-19 |
| Filipinos | 0.0 /100 | #316 | Tragic 31.7% |
| Immigrants | Nicaragua | 0.0 /100 | #317 | Tragic 31.6% |
| Immigrants | Yemen | 0.0 /100 | #318 | Tragic 31.5% |
| Soviet Union | 0.0 /100 | #319 | Tragic 31.4% |
| Ecuadorians | 0.0 /100 | #320 | Tragic 31.4% |
| West Indians | 0.0 /100 | #321 | Tragic 31.3% |
| Tohono O'odham | 0.0 /100 | #322 | Tragic 31.3% |
| Immigrants | Caribbean | 0.0 /100 | #323 | Tragic 31.2% |
| Dominicans | 0.0 /100 | #324 | Tragic 31.2% |
| Immigrants | China | 0.0 /100 | #325 | Tragic 31.1% |
| Immigrants | Dominican Republic | 0.0 /100 | #326 | Tragic 31.1% |
| Immigrants | Taiwan | 0.0 /100 | #327 | Tragic 31.0% |
| Immigrants | Ecuador | 0.0 /100 | #328 | Tragic 31.0% |
| Barbadians | 0.0 /100 | #329 | Tragic 31.0% |
| Lumbee | 0.0 /100 | #330 | Tragic 31.0% |
Demographics Similar to Moroccans by In Labor Force | Age 16-19
In terms of in labor force | age 16-19, the demographic groups most similar to Moroccans are Korean (35.7%, a difference of 0.070%), Immigrants from Switzerland (35.6%, a difference of 0.10%), Mexican (35.6%, a difference of 0.10%), Immigrants from Eastern Europe (35.8%, a difference of 0.19%), and South American Indian (35.8%, a difference of 0.21%).
| Demographics | Rating | Rank | In Labor Force | Age 16-19 |
| Senegalese | 17.4 /100 | #202 | Poor 35.9% |
| Immigrants | Nigeria | 16.8 /100 | #203 | Poor 35.8% |
| Immigrants | Albania | 15.0 /100 | #204 | Poor 35.8% |
| South American Indians | 14.6 /100 | #205 | Poor 35.8% |
| Chileans | 14.6 /100 | #206 | Poor 35.8% |
| Immigrants | Eastern Europe | 14.5 /100 | #207 | Poor 35.8% |
| Koreans | 13.3 /100 | #208 | Poor 35.7% |
| Moroccans | 12.7 /100 | #209 | Poor 35.7% |
| Immigrants | Switzerland | 11.9 /100 | #210 | Poor 35.6% |
| Mexicans | 11.9 /100 | #211 | Poor 35.6% |
| Houma | 11.0 /100 | #212 | Poor 35.6% |
| Immigrants | Bolivia | 11.0 /100 | #213 | Poor 35.6% |
| Apache | 11.0 /100 | #214 | Poor 35.6% |
| Immigrants | South Eastern Asia | 10.8 /100 | #215 | Poor 35.6% |
| Dutch West Indians | 10.7 /100 | #216 | Poor 35.6% |