Immigrants from Sudan vs Delaware In Labor Force | Age 35-44
COMPARE
Immigrants from Sudan
Delaware
In Labor Force | Age 35-44
In Labor Force | Age 35-44 Comparison
Immigrants from Sudan
Delaware
84.9%
IN LABOR FORCE | AGE 35-44
98.1/ 100
METRIC RATING
82nd/ 347
METRIC RANK
83.2%
IN LABOR FORCE | AGE 35-44
0.0/ 100
METRIC RATING
276th/ 347
METRIC RANK
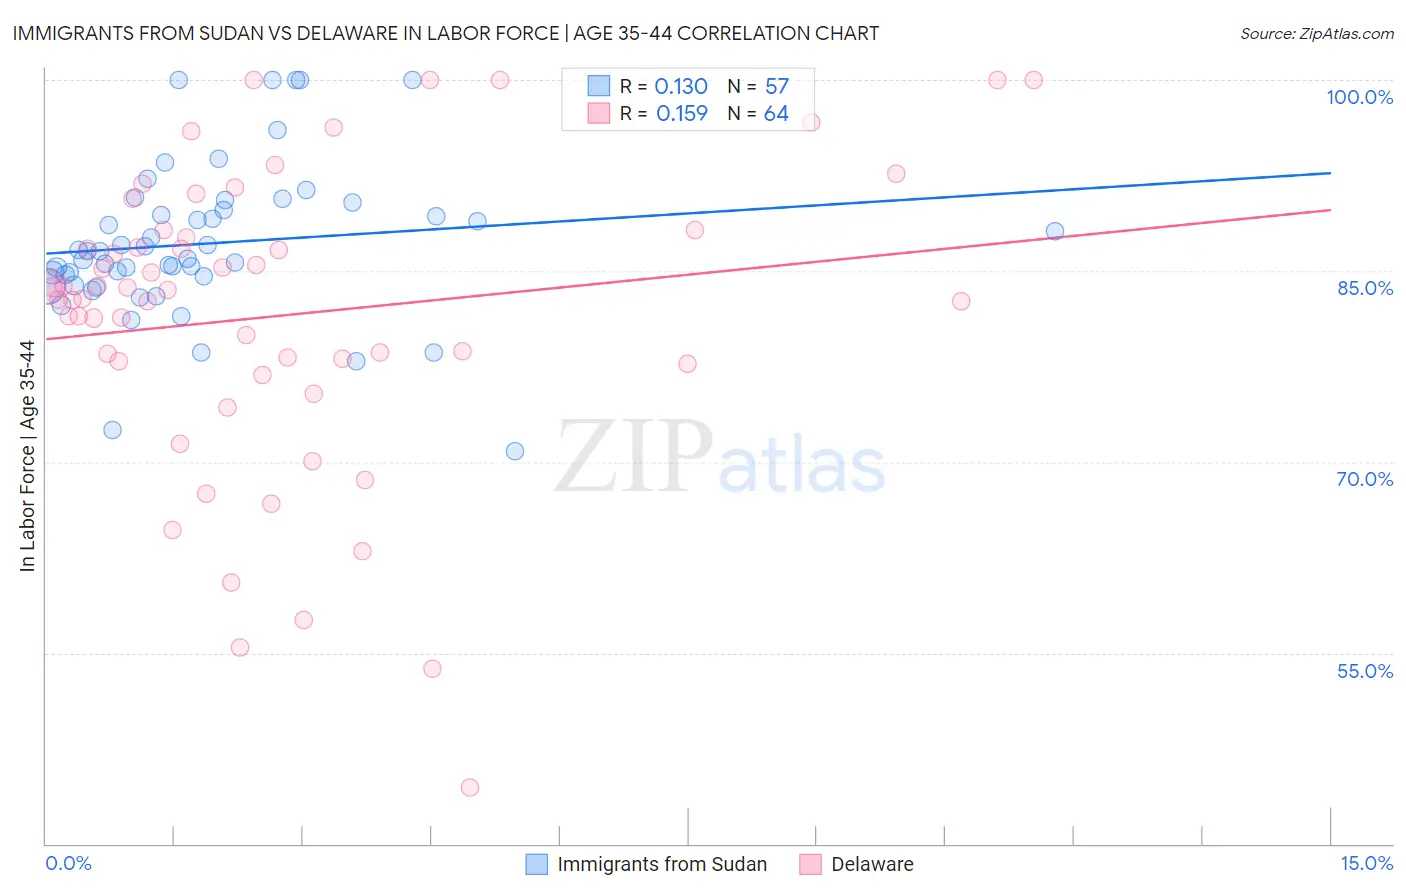
Immigrants from Sudan vs Delaware In Labor Force | Age 35-44 Correlation Chart
The statistical analysis conducted on geographies consisting of 118,957,461 people shows a poor positive correlation between the proportion of Immigrants from Sudan and labor force participation rate among population between the ages 35 and 44 in the United States with a correlation coefficient (R) of 0.130 and weighted average of 84.9%. Similarly, the statistical analysis conducted on geographies consisting of 96,216,045 people shows a poor positive correlation between the proportion of Delaware and labor force participation rate among population between the ages 35 and 44 in the United States with a correlation coefficient (R) of 0.159 and weighted average of 83.2%, a difference of 2.1%.
In Labor Force | Age 35-44 Correlation Summary
| Measurement | Immigrants from Sudan | Delaware |
| Minimum | 70.8% | 44.4% |
| Maximum | 100.0% | 100.0% |
| Range | 29.2% | 55.6% |
| Mean | 87.2% | 81.5% |
| Median | 86.5% | 83.2% |
| Interquartile 25% (IQ1) | 84.2% | 77.8% |
| Interquartile 75% (IQ3) | 90.1% | 87.9% |
| Interquartile Range (IQR) | 5.8% | 10.1% |
| Standard Deviation (Sample) | 6.1% | 11.8% |
| Standard Deviation (Population) | 6.0% | 11.8% |
Similar Demographics by In Labor Force | Age 35-44
Demographics Similar to Immigrants from Sudan by In Labor Force | Age 35-44
In terms of in labor force | age 35-44, the demographic groups most similar to Immigrants from Sudan are Peruvian (84.9%, a difference of 0.020%), Immigrants from Colombia (84.9%, a difference of 0.020%), Immigrants from Eastern Europe (84.9%, a difference of 0.020%), Senegalese (84.9%, a difference of 0.020%), and Immigrants from Peru (84.9%, a difference of 0.020%).
| Demographics | Rating | Rank | In Labor Force | Age 35-44 |
| Immigrants | South Central Asia | 98.7 /100 | #75 | Exceptional 85.0% |
| Immigrants | Cuba | 98.6 /100 | #76 | Exceptional 84.9% |
| Immigrants | Turkey | 98.6 /100 | #77 | Exceptional 84.9% |
| Immigrants | Africa | 98.4 /100 | #78 | Exceptional 84.9% |
| Peruvians | 98.3 /100 | #79 | Exceptional 84.9% |
| Immigrants | Colombia | 98.3 /100 | #80 | Exceptional 84.9% |
| Immigrants | Eastern Europe | 98.3 /100 | #81 | Exceptional 84.9% |
| Immigrants | Sudan | 98.1 /100 | #82 | Exceptional 84.9% |
| Senegalese | 97.8 /100 | #83 | Exceptional 84.9% |
| Immigrants | Peru | 97.8 /100 | #84 | Exceptional 84.9% |
| Immigrants | Middle Africa | 97.8 /100 | #85 | Exceptional 84.9% |
| Greeks | 97.8 /100 | #86 | Exceptional 84.9% |
| Belgians | 97.7 /100 | #87 | Exceptional 84.9% |
| Yugoslavians | 97.7 /100 | #88 | Exceptional 84.9% |
| Immigrants | Pakistan | 97.5 /100 | #89 | Exceptional 84.9% |
Demographics Similar to Delaware by In Labor Force | Age 35-44
In terms of in labor force | age 35-44, the demographic groups most similar to Delaware are Hawaiian (83.2%, a difference of 0.010%), Samoan (83.2%, a difference of 0.010%), Nonimmigrants (83.2%, a difference of 0.030%), Immigrants from Fiji (83.2%, a difference of 0.040%), and Spanish (83.2%, a difference of 0.040%).
| Demographics | Rating | Rank | In Labor Force | Age 35-44 |
| Immigrants | Grenada | 0.1 /100 | #269 | Tragic 83.3% |
| Immigrants | Honduras | 0.0 /100 | #270 | Tragic 83.3% |
| French American Indians | 0.0 /100 | #271 | Tragic 83.2% |
| Immigrants | Fiji | 0.0 /100 | #272 | Tragic 83.2% |
| Spanish | 0.0 /100 | #273 | Tragic 83.2% |
| Immigrants | Nonimmigrants | 0.0 /100 | #274 | Tragic 83.2% |
| Hawaiians | 0.0 /100 | #275 | Tragic 83.2% |
| Delaware | 0.0 /100 | #276 | Tragic 83.2% |
| Samoans | 0.0 /100 | #277 | Tragic 83.2% |
| Belizeans | 0.0 /100 | #278 | Tragic 83.1% |
| Immigrants | Micronesia | 0.0 /100 | #279 | Tragic 83.1% |
| Dominicans | 0.0 /100 | #280 | Tragic 83.1% |
| Guatemalans | 0.0 /100 | #281 | Tragic 83.0% |
| Osage | 0.0 /100 | #282 | Tragic 82.9% |
| Immigrants | Guatemala | 0.0 /100 | #283 | Tragic 82.9% |