Immigrants from Russia vs Delaware In Labor Force | Age 35-44
COMPARE
Immigrants from Russia
Delaware
In Labor Force | Age 35-44
In Labor Force | Age 35-44 Comparison
Immigrants from Russia
Delaware
84.8%
IN LABOR FORCE | AGE 35-44
94.5/ 100
METRIC RATING
109th/ 347
METRIC RANK
83.2%
IN LABOR FORCE | AGE 35-44
0.0/ 100
METRIC RATING
276th/ 347
METRIC RANK
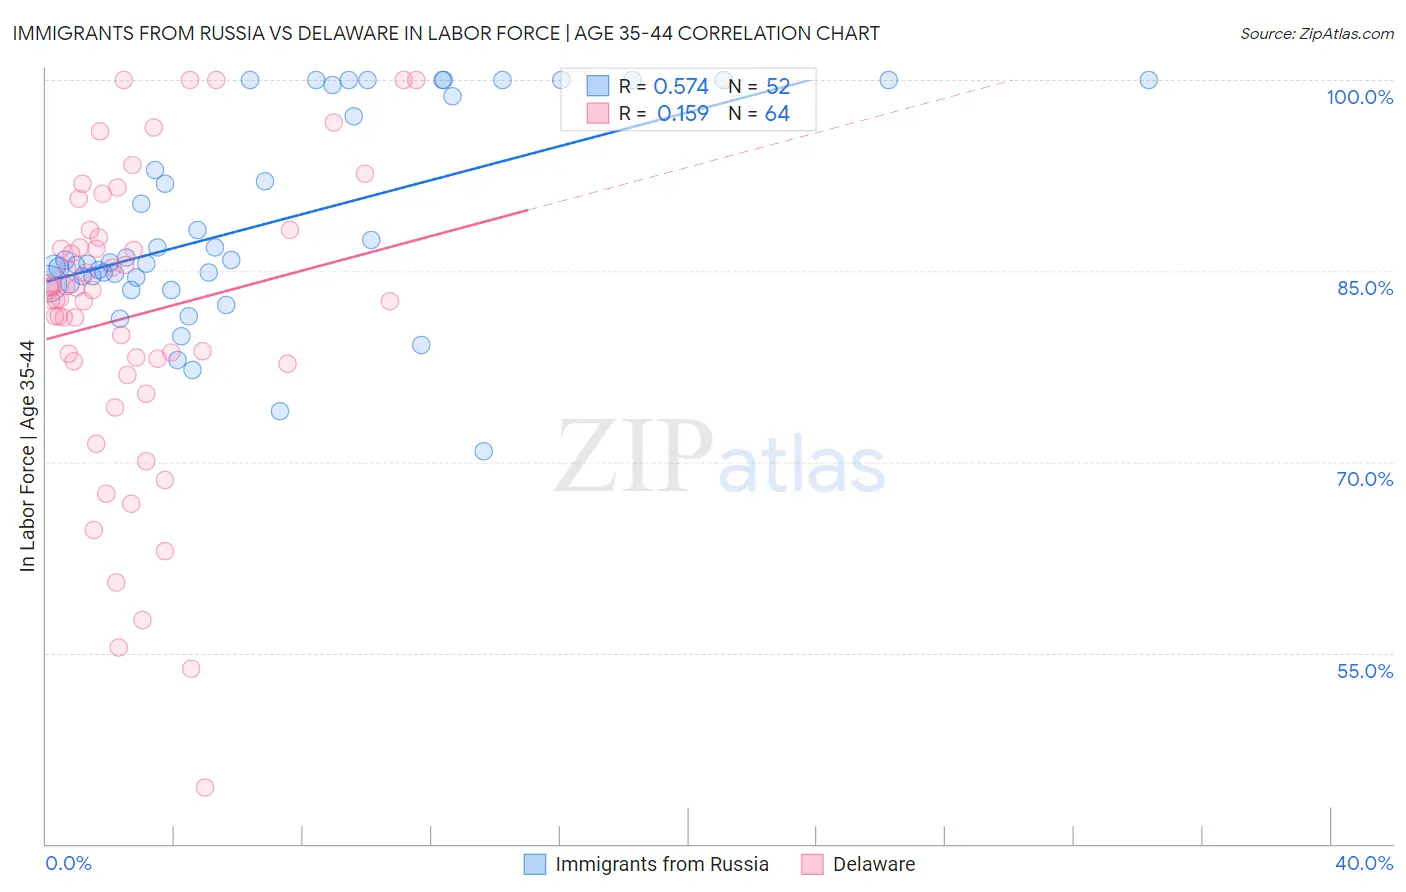
Immigrants from Russia vs Delaware In Labor Force | Age 35-44 Correlation Chart
The statistical analysis conducted on geographies consisting of 347,745,302 people shows a substantial positive correlation between the proportion of Immigrants from Russia and labor force participation rate among population between the ages 35 and 44 in the United States with a correlation coefficient (R) of 0.574 and weighted average of 84.8%. Similarly, the statistical analysis conducted on geographies consisting of 96,216,045 people shows a poor positive correlation between the proportion of Delaware and labor force participation rate among population between the ages 35 and 44 in the United States with a correlation coefficient (R) of 0.159 and weighted average of 83.2%, a difference of 1.9%.
In Labor Force | Age 35-44 Correlation Summary
| Measurement | Immigrants from Russia | Delaware |
| Minimum | 70.8% | 44.4% |
| Maximum | 100.0% | 100.0% |
| Range | 29.2% | 55.6% |
| Mean | 88.7% | 81.5% |
| Median | 85.8% | 83.2% |
| Interquartile 25% (IQ1) | 84.2% | 77.8% |
| Interquartile 75% (IQ3) | 99.1% | 87.9% |
| Interquartile Range (IQR) | 14.9% | 10.1% |
| Standard Deviation (Sample) | 8.0% | 11.8% |
| Standard Deviation (Population) | 7.9% | 11.8% |
Similar Demographics by In Labor Force | Age 35-44
Demographics Similar to Immigrants from Russia by In Labor Force | Age 35-44
In terms of in labor force | age 35-44, the demographic groups most similar to Immigrants from Russia are Immigrants from Argentina (84.8%, a difference of 0.0%), Immigrants from Bahamas (84.8%, a difference of 0.010%), Immigrants from Romania (84.8%, a difference of 0.010%), Immigrants from Sweden (84.8%, a difference of 0.020%), and South American (84.8%, a difference of 0.020%).
| Demographics | Rating | Rank | In Labor Force | Age 35-44 |
| Immigrants | Southern Europe | 95.3 /100 | #102 | Exceptional 84.8% |
| Immigrants | Belarus | 95.3 /100 | #103 | Exceptional 84.8% |
| Immigrants | Sweden | 95.2 /100 | #104 | Exceptional 84.8% |
| South Americans | 95.0 /100 | #105 | Exceptional 84.8% |
| Immigrants | Bahamas | 94.8 /100 | #106 | Exceptional 84.8% |
| Immigrants | Romania | 94.7 /100 | #107 | Exceptional 84.8% |
| Immigrants | Argentina | 94.5 /100 | #108 | Exceptional 84.8% |
| Immigrants | Russia | 94.5 /100 | #109 | Exceptional 84.8% |
| Filipinos | 93.8 /100 | #110 | Exceptional 84.7% |
| Ukrainians | 93.5 /100 | #111 | Exceptional 84.7% |
| Immigrants | Western Africa | 93.4 /100 | #112 | Exceptional 84.7% |
| Uruguayans | 93.3 /100 | #113 | Exceptional 84.7% |
| Chileans | 93.2 /100 | #114 | Exceptional 84.7% |
| Bahamians | 93.2 /100 | #115 | Exceptional 84.7% |
| Immigrants | Egypt | 92.7 /100 | #116 | Exceptional 84.7% |
Demographics Similar to Delaware by In Labor Force | Age 35-44
In terms of in labor force | age 35-44, the demographic groups most similar to Delaware are Hawaiian (83.2%, a difference of 0.010%), Samoan (83.2%, a difference of 0.010%), Nonimmigrants (83.2%, a difference of 0.030%), Immigrants from Fiji (83.2%, a difference of 0.040%), and Spanish (83.2%, a difference of 0.040%).
| Demographics | Rating | Rank | In Labor Force | Age 35-44 |
| Immigrants | Grenada | 0.1 /100 | #269 | Tragic 83.3% |
| Immigrants | Honduras | 0.0 /100 | #270 | Tragic 83.3% |
| French American Indians | 0.0 /100 | #271 | Tragic 83.2% |
| Immigrants | Fiji | 0.0 /100 | #272 | Tragic 83.2% |
| Spanish | 0.0 /100 | #273 | Tragic 83.2% |
| Immigrants | Nonimmigrants | 0.0 /100 | #274 | Tragic 83.2% |
| Hawaiians | 0.0 /100 | #275 | Tragic 83.2% |
| Delaware | 0.0 /100 | #276 | Tragic 83.2% |
| Samoans | 0.0 /100 | #277 | Tragic 83.2% |
| Belizeans | 0.0 /100 | #278 | Tragic 83.1% |
| Immigrants | Micronesia | 0.0 /100 | #279 | Tragic 83.1% |
| Dominicans | 0.0 /100 | #280 | Tragic 83.1% |
| Guatemalans | 0.0 /100 | #281 | Tragic 83.0% |
| Osage | 0.0 /100 | #282 | Tragic 82.9% |
| Immigrants | Guatemala | 0.0 /100 | #283 | Tragic 82.9% |