Immigrants from Cabo Verde vs Immigrants from Mexico 7th Grade
COMPARE
Immigrants from Cabo Verde
Immigrants from Mexico
7th Grade
7th Grade Comparison
Immigrants from Cabo Verde
Immigrants from Mexico
93.1%
7TH GRADE
0.0/ 100
METRIC RATING
327th/ 347
METRIC RANK
90.7%
7TH GRADE
0.0/ 100
METRIC RATING
346th/ 347
METRIC RANK
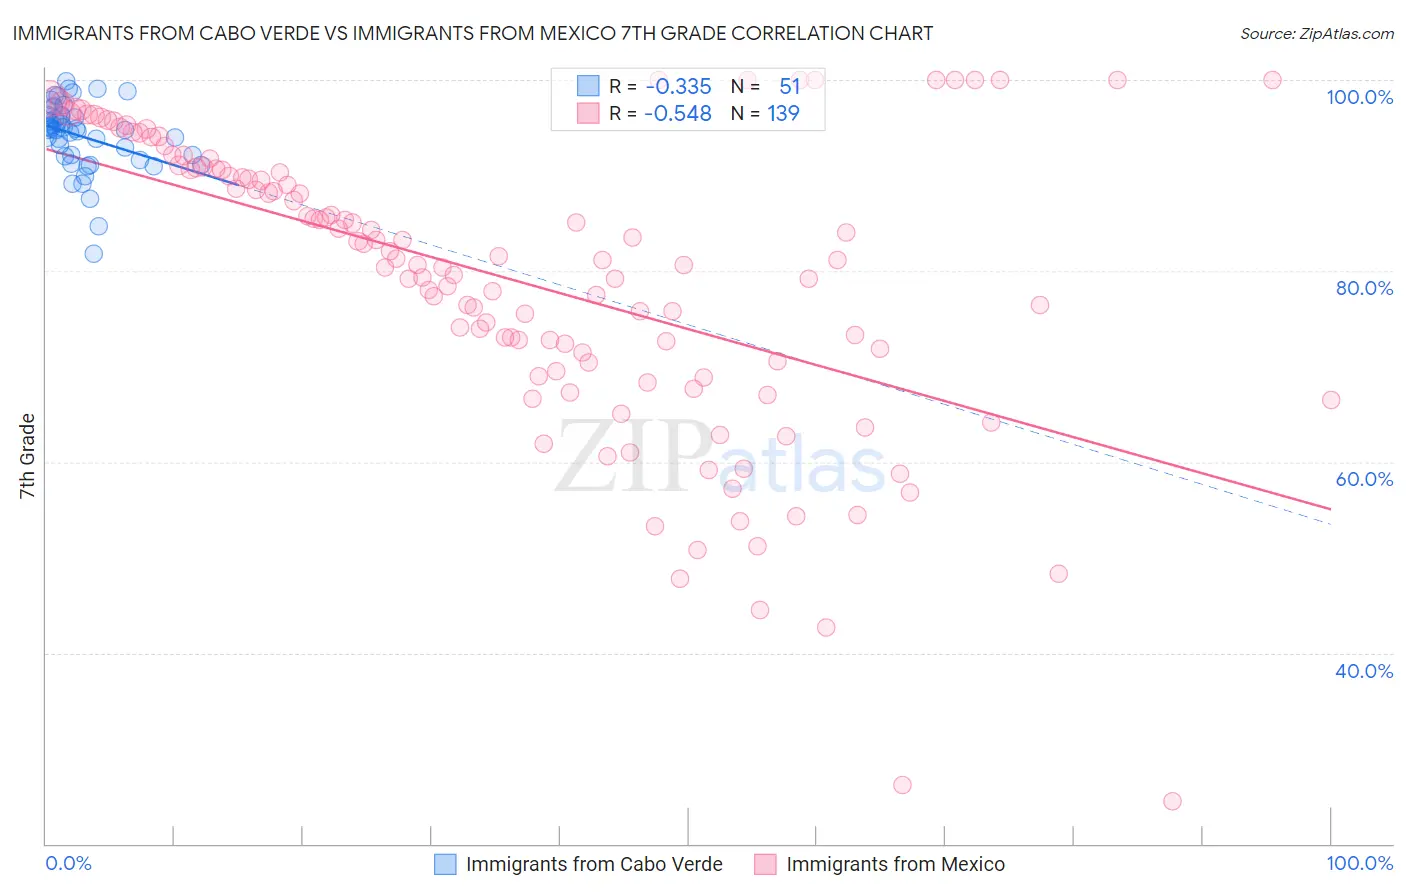
Immigrants from Cabo Verde vs Immigrants from Mexico 7th Grade Correlation Chart
The statistical analysis conducted on geographies consisting of 38,158,316 people shows a mild negative correlation between the proportion of Immigrants from Cabo Verde and percentage of population with at least 7th grade education in the United States with a correlation coefficient (R) of -0.335 and weighted average of 93.1%. Similarly, the statistical analysis conducted on geographies consisting of 513,767,254 people shows a substantial negative correlation between the proportion of Immigrants from Mexico and percentage of population with at least 7th grade education in the United States with a correlation coefficient (R) of -0.548 and weighted average of 90.7%, a difference of 2.6%.
7th Grade Correlation Summary
| Measurement | Immigrants from Cabo Verde | Immigrants from Mexico |
| Minimum | 81.8% | 24.5% |
| Maximum | 99.9% | 100.0% |
| Range | 18.1% | 75.5% |
| Mean | 94.1% | 79.2% |
| Median | 94.8% | 81.2% |
| Interquartile 25% (IQ1) | 92.0% | 70.4% |
| Interquartile 75% (IQ3) | 96.3% | 90.9% |
| Interquartile Range (IQR) | 4.3% | 20.4% |
| Standard Deviation (Sample) | 3.6% | 15.5% |
| Standard Deviation (Population) | 3.6% | 15.5% |
Demographics Similar to Immigrants from Cabo Verde and Immigrants from Mexico by 7th Grade
In terms of 7th grade, the demographic groups most similar to Immigrants from Cabo Verde are Nepalese (93.2%, a difference of 0.070%), Immigrants from Nicaragua (93.0%, a difference of 0.13%), Immigrants from the Azores (93.0%, a difference of 0.17%), Immigrants from Dominican Republic (92.9%, a difference of 0.22%), and Honduran (92.9%, a difference of 0.26%). Similarly, the demographic groups most similar to Immigrants from Mexico are Immigrants from El Salvador (90.9%, a difference of 0.20%), Immigrants from Central America (91.0%, a difference of 0.27%), Immigrants from Guatemala (91.3%, a difference of 0.63%), Salvadoran (91.5%, a difference of 0.79%), and Guatemalan (91.7%, a difference of 1.1%).
| Demographics | Rating | Rank | 7th Grade |
| Nepalese | 0.0 /100 | #326 | Tragic 93.2% |
| Immigrants | Cabo Verde | 0.0 /100 | #327 | Tragic 93.1% |
| Immigrants | Nicaragua | 0.0 /100 | #328 | Tragic 93.0% |
| Immigrants | Azores | 0.0 /100 | #329 | Tragic 93.0% |
| Immigrants | Dominican Republic | 0.0 /100 | #330 | Tragic 92.9% |
| Hondurans | 0.0 /100 | #331 | Tragic 92.9% |
| Hispanics or Latinos | 0.0 /100 | #332 | Tragic 92.7% |
| Immigrants | Armenia | 0.0 /100 | #333 | Tragic 92.7% |
| Immigrants | Yemen | 0.0 /100 | #334 | Tragic 92.6% |
| Mexican American Indians | 0.0 /100 | #335 | Tragic 92.6% |
| Immigrants | Honduras | 0.0 /100 | #336 | Tragic 92.5% |
| Immigrants | Latin America | 0.0 /100 | #337 | Tragic 92.2% |
| Central Americans | 0.0 /100 | #338 | Tragic 92.1% |
| Mexicans | 0.0 /100 | #339 | Tragic 91.9% |
| Yakama | 0.0 /100 | #340 | Tragic 91.7% |
| Guatemalans | 0.0 /100 | #341 | Tragic 91.7% |
| Salvadorans | 0.0 /100 | #342 | Tragic 91.5% |
| Immigrants | Guatemala | 0.0 /100 | #343 | Tragic 91.3% |
| Immigrants | Central America | 0.0 /100 | #344 | Tragic 91.0% |
| Immigrants | El Salvador | 0.0 /100 | #345 | Tragic 90.9% |
| Immigrants | Mexico | 0.0 /100 | #346 | Tragic 90.7% |