Immigrants from Cabo Verde vs Immigrants from Eastern Africa In Labor Force | Age > 16
COMPARE
Immigrants from Cabo Verde
Immigrants from Eastern Africa
In Labor Force | Age > 16
In Labor Force | Age > 16 Comparison
Immigrants from Cabo Verde
Immigrants from Eastern Africa
67.3%
IN LABOR FORCE | AGE > 16
100.0/ 100
METRIC RATING
26th/ 347
METRIC RANK
68.5%
IN LABOR FORCE | AGE > 16
100.0/ 100
METRIC RATING
9th/ 347
METRIC RANK
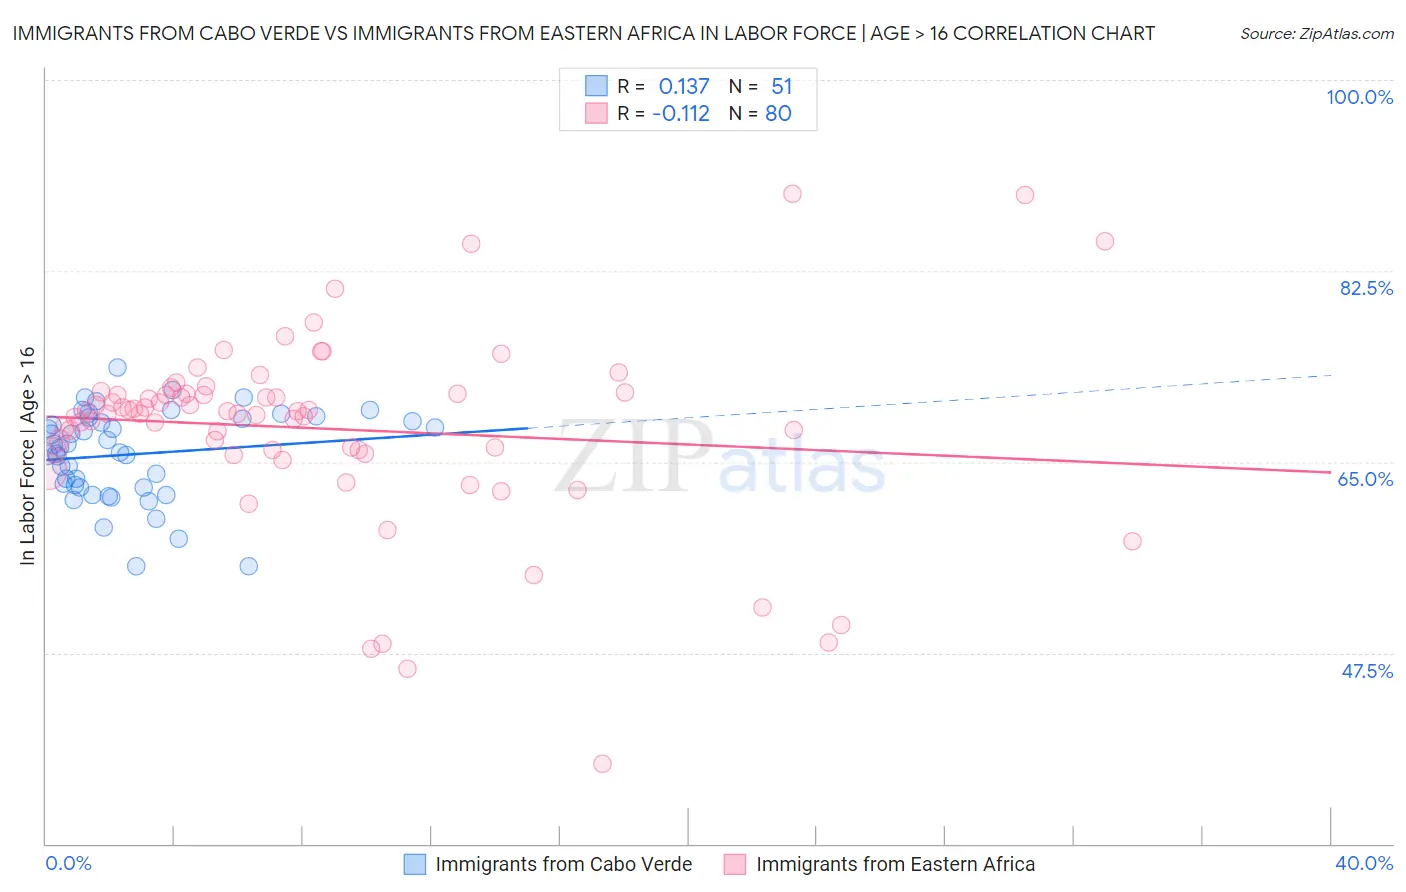
Immigrants from Cabo Verde vs Immigrants from Eastern Africa In Labor Force | Age > 16 Correlation Chart
The statistical analysis conducted on geographies consisting of 38,158,316 people shows a poor positive correlation between the proportion of Immigrants from Cabo Verde and labor force participation rate among population ages 16 and over in the United States with a correlation coefficient (R) of 0.137 and weighted average of 67.3%. Similarly, the statistical analysis conducted on geographies consisting of 355,171,869 people shows a poor negative correlation between the proportion of Immigrants from Eastern Africa and labor force participation rate among population ages 16 and over in the United States with a correlation coefficient (R) of -0.112 and weighted average of 68.5%, a difference of 1.7%.
In Labor Force | Age > 16 Correlation Summary
| Measurement | Immigrants from Cabo Verde | Immigrants from Eastern Africa |
| Minimum | 55.4% | 37.3% |
| Maximum | 73.7% | 89.6% |
| Range | 18.3% | 52.3% |
| Mean | 65.7% | 68.0% |
| Median | 66.3% | 69.5% |
| Interquartile 25% (IQ1) | 62.6% | 66.0% |
| Interquartile 75% (IQ3) | 69.0% | 71.3% |
| Interquartile Range (IQR) | 6.4% | 5.2% |
| Standard Deviation (Sample) | 4.1% | 8.8% |
| Standard Deviation (Population) | 4.1% | 8.7% |
Demographics Similar to Immigrants from Cabo Verde and Immigrants from Eastern Africa by In Labor Force | Age > 16
In terms of in labor force | age > 16, the demographic groups most similar to Immigrants from Cabo Verde are Immigrants from Africa (67.4%, a difference of 0.030%), Ugandan (67.4%, a difference of 0.050%), Zimbabwean (67.3%, a difference of 0.080%), Cambodian (67.4%, a difference of 0.12%), and Immigrants from Uganda (67.5%, a difference of 0.23%). Similarly, the demographic groups most similar to Immigrants from Eastern Africa are Immigrants from Sierra Leone (68.5%, a difference of 0.010%), Immigrants from Bolivia (68.4%, a difference of 0.030%), Immigrants from Cameroon (68.7%, a difference of 0.33%), Bolivian (68.2%, a difference of 0.40%), and Sudanese (68.0%, a difference of 0.62%).
| Demographics | Rating | Rank | In Labor Force | Age > 16 |
| Immigrants | Cameroon | 100.0 /100 | #7 | Exceptional 68.7% |
| Immigrants | Sierra Leone | 100.0 /100 | #8 | Exceptional 68.5% |
| Immigrants | Eastern Africa | 100.0 /100 | #9 | Exceptional 68.5% |
| Immigrants | Bolivia | 100.0 /100 | #10 | Exceptional 68.4% |
| Bolivians | 100.0 /100 | #11 | Exceptional 68.2% |
| Sudanese | 100.0 /100 | #12 | Exceptional 68.0% |
| Immigrants | Nepal | 100.0 /100 | #13 | Exceptional 68.0% |
| Liberians | 100.0 /100 | #14 | Exceptional 67.8% |
| Immigrants | Middle Africa | 100.0 /100 | #15 | Exceptional 67.7% |
| Immigrants | Sudan | 100.0 /100 | #16 | Exceptional 67.7% |
| Immigrants | India | 100.0 /100 | #17 | Exceptional 67.6% |
| Immigrants | Liberia | 100.0 /100 | #18 | Exceptional 67.6% |
| Kenyans | 100.0 /100 | #19 | Exceptional 67.6% |
| Immigrants | Kenya | 100.0 /100 | #20 | Exceptional 67.6% |
| Tongans | 100.0 /100 | #21 | Exceptional 67.5% |
| Immigrants | Uganda | 100.0 /100 | #22 | Exceptional 67.5% |
| Cambodians | 100.0 /100 | #23 | Exceptional 67.4% |
| Ugandans | 100.0 /100 | #24 | Exceptional 67.4% |
| Immigrants | Africa | 100.0 /100 | #25 | Exceptional 67.4% |
| Immigrants | Cabo Verde | 100.0 /100 | #26 | Exceptional 67.3% |
| Zimbabweans | 100.0 /100 | #27 | Exceptional 67.3% |