Immigrants from Bulgaria vs Native/Alaskan Bachelor's Degree
COMPARE
Immigrants from Bulgaria
Native/Alaskan
Bachelor's Degree
Bachelor's Degree Comparison
Immigrants from Bulgaria
Natives/Alaskans
44.6%
BACHELOR'S DEGREE
99.9/ 100
METRIC RATING
46th/ 347
METRIC RANK
26.3%
BACHELOR'S DEGREE
0.0/ 100
METRIC RATING
335th/ 347
METRIC RANK
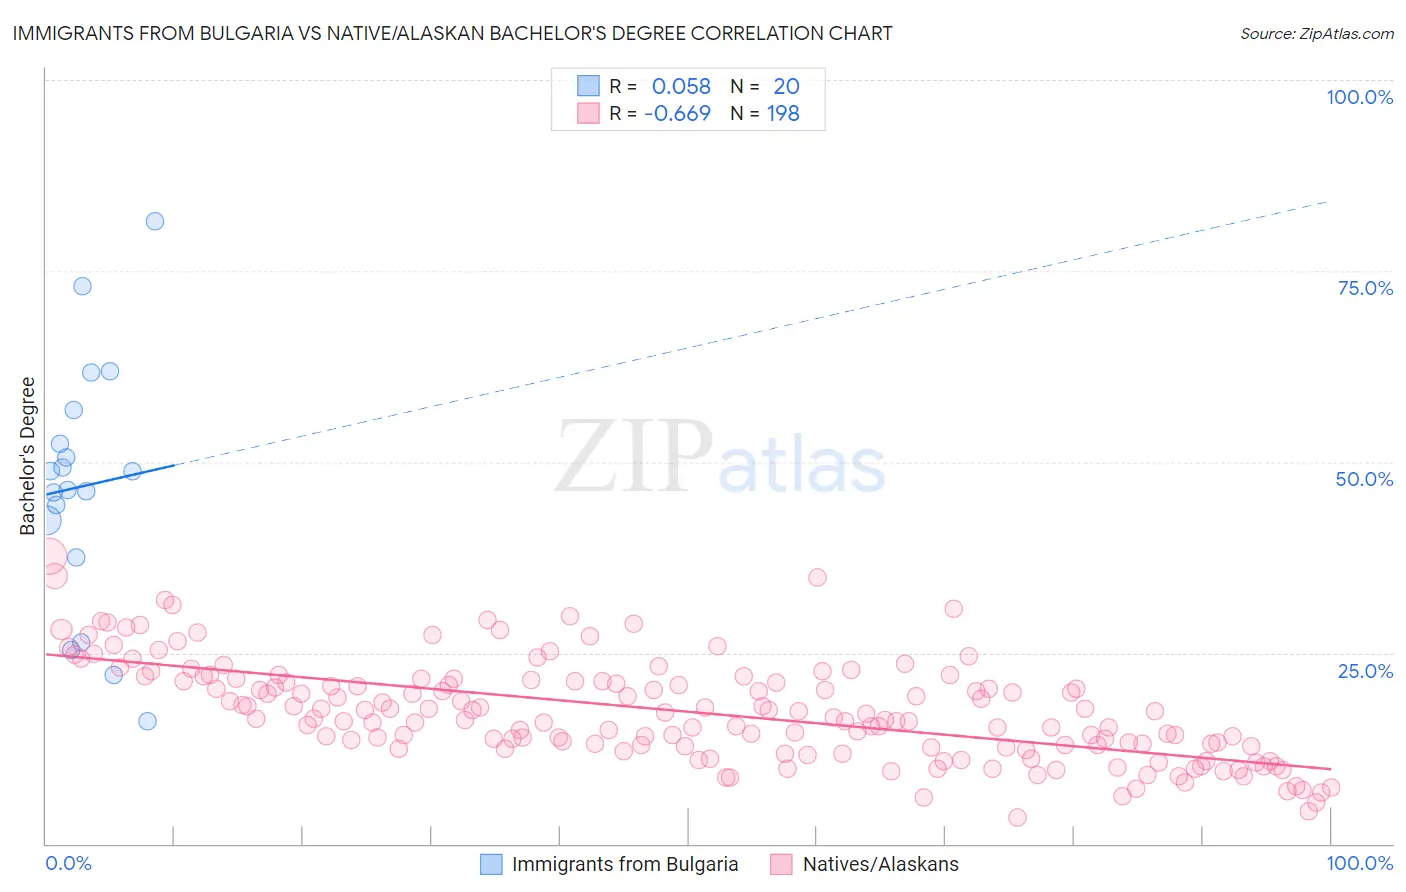
Immigrants from Bulgaria vs Native/Alaskan Bachelor's Degree Correlation Chart
The statistical analysis conducted on geographies consisting of 172,546,854 people shows a slight positive correlation between the proportion of Immigrants from Bulgaria and percentage of population with at least bachelor's degree education in the United States with a correlation coefficient (R) of 0.058 and weighted average of 44.6%. Similarly, the statistical analysis conducted on geographies consisting of 512,966,883 people shows a significant negative correlation between the proportion of Natives/Alaskans and percentage of population with at least bachelor's degree education in the United States with a correlation coefficient (R) of -0.669 and weighted average of 26.3%, a difference of 69.4%.
Bachelor's Degree Correlation Summary
| Measurement | Immigrants from Bulgaria | Native/Alaskan |
| Minimum | 16.1% | 3.5% |
| Maximum | 81.6% | 37.7% |
| Range | 65.5% | 34.2% |
| Mean | 46.9% | 17.3% |
| Median | 47.6% | 16.5% |
| Interquartile 25% (IQ1) | 39.9% | 12.7% |
| Interquartile 75% (IQ3) | 54.5% | 21.3% |
| Interquartile Range (IQR) | 14.6% | 8.6% |
| Standard Deviation (Sample) | 16.3% | 6.5% |
| Standard Deviation (Population) | 15.9% | 6.5% |
Similar Demographics by Bachelor's Degree
Demographics Similar to Immigrants from Bulgaria by Bachelor's Degree
In terms of bachelor's degree, the demographic groups most similar to Immigrants from Bulgaria are Bolivian (44.6%, a difference of 0.040%), Estonian (44.6%, a difference of 0.040%), Immigrants from Kuwait (44.6%, a difference of 0.060%), Immigrants from Lithuania (44.6%, a difference of 0.080%), and Immigrants from Norway (44.5%, a difference of 0.16%).
| Demographics | Rating | Rank | Bachelor's Degree |
| Immigrants | Latvia | 100.0 /100 | #39 | Exceptional 45.1% |
| Immigrants | Belarus | 100.0 /100 | #40 | Exceptional 45.0% |
| Immigrants | Malaysia | 100.0 /100 | #41 | Exceptional 45.0% |
| Immigrants | Saudi Arabia | 100.0 /100 | #42 | Exceptional 44.8% |
| Immigrants | South Africa | 99.9 /100 | #43 | Exceptional 44.8% |
| Immigrants | Lithuania | 99.9 /100 | #44 | Exceptional 44.6% |
| Immigrants | Kuwait | 99.9 /100 | #45 | Exceptional 44.6% |
| Immigrants | Bulgaria | 99.9 /100 | #46 | Exceptional 44.6% |
| Bolivians | 99.9 /100 | #47 | Exceptional 44.6% |
| Estonians | 99.9 /100 | #48 | Exceptional 44.6% |
| Immigrants | Norway | 99.9 /100 | #49 | Exceptional 44.5% |
| Immigrants | Greece | 99.9 /100 | #50 | Exceptional 44.5% |
| Asians | 99.9 /100 | #51 | Exceptional 44.4% |
| Immigrants | Spain | 99.9 /100 | #52 | Exceptional 44.3% |
| Immigrants | Asia | 99.9 /100 | #53 | Exceptional 44.3% |
Demographics Similar to Natives/Alaskans by Bachelor's Degree
In terms of bachelor's degree, the demographic groups most similar to Natives/Alaskans are Immigrants from Mexico (26.1%, a difference of 0.70%), Arapaho (26.6%, a difference of 1.1%), Inupiat (25.8%, a difference of 2.0%), Mexican (27.1%, a difference of 2.9%), and Pueblo (25.5%, a difference of 3.1%).
| Demographics | Rating | Rank | Bachelor's Degree |
| Crow | 0.0 /100 | #328 | Tragic 27.7% |
| Immigrants | Central America | 0.0 /100 | #329 | Tragic 27.5% |
| Spanish American Indians | 0.0 /100 | #330 | Tragic 27.5% |
| Immigrants | Azores | 0.0 /100 | #331 | Tragic 27.3% |
| Menominee | 0.0 /100 | #332 | Tragic 27.3% |
| Mexicans | 0.0 /100 | #333 | Tragic 27.1% |
| Arapaho | 0.0 /100 | #334 | Tragic 26.6% |
| Natives/Alaskans | 0.0 /100 | #335 | Tragic 26.3% |
| Immigrants | Mexico | 0.0 /100 | #336 | Tragic 26.1% |
| Inupiat | 0.0 /100 | #337 | Tragic 25.8% |
| Pueblo | 0.0 /100 | #338 | Tragic 25.5% |
| Hopi | 0.0 /100 | #339 | Tragic 25.3% |
| Lumbee | 0.0 /100 | #340 | Tragic 24.8% |
| Yuman | 0.0 /100 | #341 | Tragic 24.5% |
| Yakama | 0.0 /100 | #342 | Tragic 24.5% |