Immigrants from Bulgaria vs Native/Alaskan Married-couple Households
COMPARE
Immigrants from Bulgaria
Native/Alaskan
Married-couple Households
Married-couple Households Comparison
Immigrants from Bulgaria
Natives/Alaskans
47.0%
MARRIED-COUPLE HOUSEHOLDS
76.8/ 100
METRIC RATING
151st/ 347
METRIC RANK
43.5%
MARRIED-COUPLE HOUSEHOLDS
0.1/ 100
METRIC RATING
267th/ 347
METRIC RANK
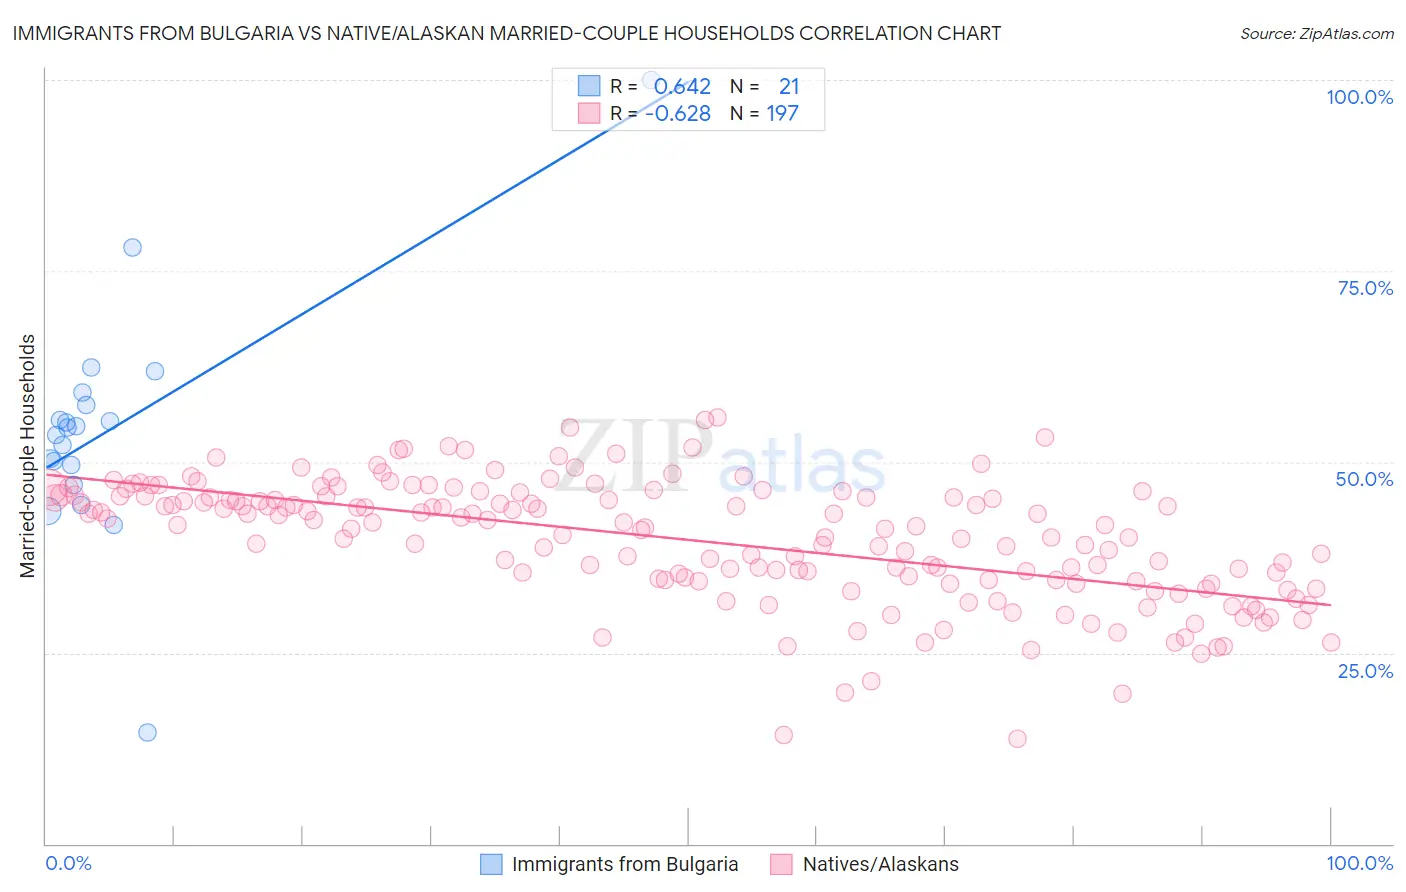
Immigrants from Bulgaria vs Native/Alaskan Married-couple Households Correlation Chart
The statistical analysis conducted on geographies consisting of 172,541,029 people shows a significant positive correlation between the proportion of Immigrants from Bulgaria and percentage of married-couple family households in the United States with a correlation coefficient (R) of 0.642 and weighted average of 47.0%. Similarly, the statistical analysis conducted on geographies consisting of 512,631,690 people shows a significant negative correlation between the proportion of Natives/Alaskans and percentage of married-couple family households in the United States with a correlation coefficient (R) of -0.628 and weighted average of 43.5%, a difference of 8.1%.
Married-couple Households Correlation Summary
| Measurement | Immigrants from Bulgaria | Native/Alaskan |
| Minimum | 14.5% | 13.8% |
| Maximum | 100.0% | 55.8% |
| Range | 85.5% | 42.1% |
| Mean | 54.3% | 39.8% |
| Median | 54.5% | 41.7% |
| Interquartile 25% (IQ1) | 48.2% | 34.5% |
| Interquartile 75% (IQ3) | 58.2% | 45.5% |
| Interquartile Range (IQR) | 10.0% | 11.0% |
| Standard Deviation (Sample) | 15.6% | 7.9% |
| Standard Deviation (Population) | 15.2% | 7.9% |
Similar Demographics by Married-couple Households
Demographics Similar to Immigrants from Bulgaria by Married-couple Households
In terms of married-couple households, the demographic groups most similar to Immigrants from Bulgaria are Serbian (47.0%, a difference of 0.020%), Hmong (47.0%, a difference of 0.030%), Immigrants from Western Asia (46.9%, a difference of 0.040%), Arab (46.9%, a difference of 0.040%), and Immigrants from Russia (47.0%, a difference of 0.050%).
| Demographics | Rating | Rank | Married-couple Households |
| Mexicans | 83.4 /100 | #144 | Excellent 47.1% |
| Slovenes | 81.7 /100 | #145 | Excellent 47.1% |
| Immigrants | Western Europe | 81.6 /100 | #146 | Excellent 47.1% |
| Immigrants | Syria | 81.6 /100 | #147 | Excellent 47.1% |
| Icelanders | 79.5 /100 | #148 | Good 47.0% |
| Paraguayans | 78.7 /100 | #149 | Good 47.0% |
| Immigrants | Russia | 77.6 /100 | #150 | Good 47.0% |
| Immigrants | Bulgaria | 76.8 /100 | #151 | Good 47.0% |
| Serbians | 76.3 /100 | #152 | Good 47.0% |
| Hmong | 76.2 /100 | #153 | Good 47.0% |
| Immigrants | Western Asia | 76.1 /100 | #154 | Good 46.9% |
| Arabs | 76.0 /100 | #155 | Good 46.9% |
| Armenians | 75.4 /100 | #156 | Good 46.9% |
| Immigrants | Oceania | 74.8 /100 | #157 | Good 46.9% |
| Immigrants | Nonimmigrants | 73.3 /100 | #158 | Good 46.9% |
Demographics Similar to Natives/Alaskans by Married-couple Households
In terms of married-couple households, the demographic groups most similar to Natives/Alaskans are Ecuadorian (43.5%, a difference of 0.050%), Moroccan (43.5%, a difference of 0.090%), Immigrants from Burma/Myanmar (43.4%, a difference of 0.10%), Bangladeshi (43.5%, a difference of 0.17%), and Cree (43.6%, a difference of 0.29%).
| Demographics | Rating | Rank | Married-couple Households |
| Immigrants | Cameroon | 0.2 /100 | #260 | Tragic 43.7% |
| Alaskan Athabascans | 0.2 /100 | #261 | Tragic 43.6% |
| Vietnamese | 0.2 /100 | #262 | Tragic 43.6% |
| Cree | 0.1 /100 | #263 | Tragic 43.6% |
| Bangladeshis | 0.1 /100 | #264 | Tragic 43.5% |
| Moroccans | 0.1 /100 | #265 | Tragic 43.5% |
| Ecuadorians | 0.1 /100 | #266 | Tragic 43.5% |
| Natives/Alaskans | 0.1 /100 | #267 | Tragic 43.5% |
| Immigrants | Burma/Myanmar | 0.1 /100 | #268 | Tragic 43.4% |
| Immigrants | Sierra Leone | 0.1 /100 | #269 | Tragic 43.3% |
| Yuman | 0.1 /100 | #270 | Tragic 43.3% |
| Guatemalans | 0.1 /100 | #271 | Tragic 43.3% |
| Immigrants | Nigeria | 0.1 /100 | #272 | Tragic 43.2% |
| Ethiopians | 0.1 /100 | #273 | Tragic 43.2% |
| Nigerians | 0.1 /100 | #274 | Tragic 43.2% |