Immigrants from Bulgaria vs Immigrants from Indonesia In Labor Force | Age 30-34
COMPARE
Immigrants from Bulgaria
Immigrants from Indonesia
In Labor Force | Age 30-34
In Labor Force | Age 30-34 Comparison
Immigrants from Bulgaria
Immigrants from Indonesia
86.0%
IN LABOR FORCE | AGE 30-34
100.0/ 100
METRIC RATING
21st/ 347
METRIC RANK
84.9%
IN LABOR FORCE | AGE 30-34
84.3/ 100
METRIC RATING
142nd/ 347
METRIC RANK
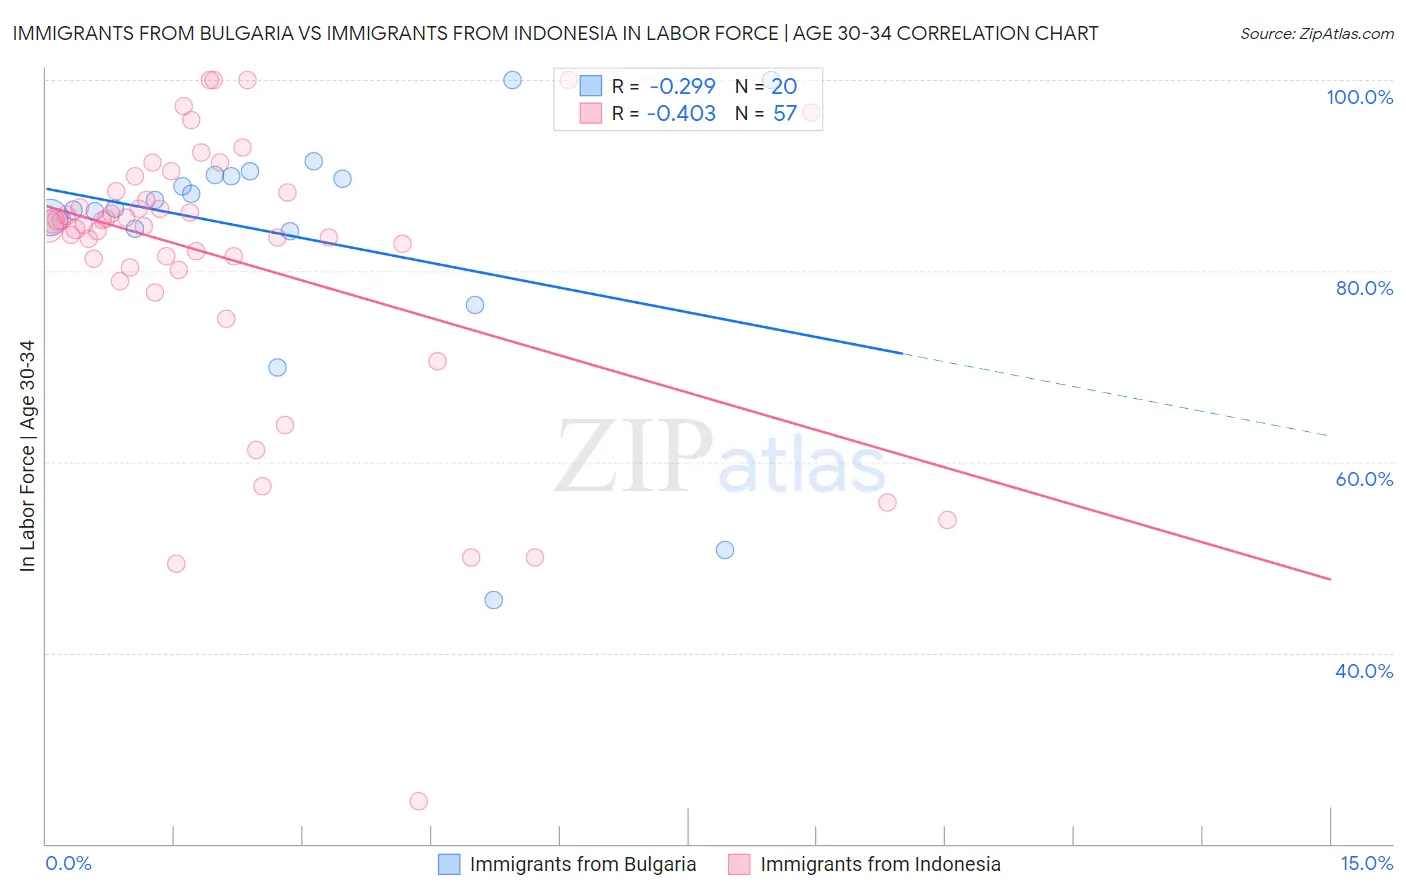
Immigrants from Bulgaria vs Immigrants from Indonesia In Labor Force | Age 30-34 Correlation Chart
The statistical analysis conducted on geographies consisting of 172,547,682 people shows a weak negative correlation between the proportion of Immigrants from Bulgaria and labor force participation rate among population between the ages 30 and 34 in the United States with a correlation coefficient (R) of -0.299 and weighted average of 86.0%. Similarly, the statistical analysis conducted on geographies consisting of 215,722,421 people shows a moderate negative correlation between the proportion of Immigrants from Indonesia and labor force participation rate among population between the ages 30 and 34 in the United States with a correlation coefficient (R) of -0.403 and weighted average of 84.9%, a difference of 1.2%.
In Labor Force | Age 30-34 Correlation Summary
| Measurement | Immigrants from Bulgaria | Immigrants from Indonesia |
| Minimum | 45.5% | 24.5% |
| Maximum | 100.0% | 100.0% |
| Range | 54.5% | 75.5% |
| Mean | 83.6% | 81.2% |
| Median | 87.0% | 84.8% |
| Interquartile 25% (IQ1) | 84.3% | 80.3% |
| Interquartile 75% (IQ3) | 90.0% | 88.3% |
| Interquartile Range (IQR) | 5.7% | 8.0% |
| Standard Deviation (Sample) | 13.8% | 14.8% |
| Standard Deviation (Population) | 13.5% | 14.7% |
Similar Demographics by In Labor Force | Age 30-34
Demographics Similar to Immigrants from Bulgaria by In Labor Force | Age 30-34
In terms of in labor force | age 30-34, the demographic groups most similar to Immigrants from Bulgaria are Bulgarian (86.0%, a difference of 0.0%), Sierra Leonean (86.0%, a difference of 0.010%), Bermudan (85.9%, a difference of 0.020%), Estonian (85.9%, a difference of 0.030%), and Immigrants from Eritrea (85.9%, a difference of 0.040%).
| Demographics | Rating | Rank | In Labor Force | Age 30-34 |
| Immigrants | Cabo Verde | 100.0 /100 | #14 | Exceptional 86.1% |
| Immigrants | Albania | 100.0 /100 | #15 | Exceptional 86.1% |
| Latvians | 100.0 /100 | #16 | Exceptional 86.0% |
| Immigrants | Cameroon | 100.0 /100 | #17 | Exceptional 86.0% |
| Immigrants | Sierra Leone | 100.0 /100 | #18 | Exceptional 86.0% |
| Sierra Leoneans | 100.0 /100 | #19 | Exceptional 86.0% |
| Bulgarians | 100.0 /100 | #20 | Exceptional 86.0% |
| Immigrants | Bulgaria | 100.0 /100 | #21 | Exceptional 86.0% |
| Bermudans | 100.0 /100 | #22 | Exceptional 85.9% |
| Estonians | 100.0 /100 | #23 | Exceptional 85.9% |
| Immigrants | Eritrea | 100.0 /100 | #24 | Exceptional 85.9% |
| Immigrants | North Macedonia | 100.0 /100 | #25 | Exceptional 85.9% |
| Immigrants | Eastern Africa | 100.0 /100 | #26 | Exceptional 85.9% |
| Immigrants | Liberia | 100.0 /100 | #27 | Exceptional 85.9% |
| Immigrants | Latvia | 100.0 /100 | #28 | Exceptional 85.9% |
Demographics Similar to Immigrants from Indonesia by In Labor Force | Age 30-34
In terms of in labor force | age 30-34, the demographic groups most similar to Immigrants from Indonesia are Chilean (84.9%, a difference of 0.010%), Immigrants from Vietnam (85.0%, a difference of 0.030%), Colombian (84.9%, a difference of 0.030%), South African (85.0%, a difference of 0.050%), and Sri Lankan (85.0%, a difference of 0.050%).
| Demographics | Rating | Rank | In Labor Force | Age 30-34 |
| Immigrants | Asia | 88.9 /100 | #135 | Excellent 85.0% |
| Jordanians | 88.6 /100 | #136 | Excellent 85.0% |
| South Africans | 88.0 /100 | #137 | Excellent 85.0% |
| Sri Lankans | 87.8 /100 | #138 | Excellent 85.0% |
| Bhutanese | 87.5 /100 | #139 | Excellent 85.0% |
| Immigrants | Vietnam | 86.5 /100 | #140 | Excellent 85.0% |
| Chileans | 85.3 /100 | #141 | Excellent 84.9% |
| Immigrants | Indonesia | 84.3 /100 | #142 | Excellent 84.9% |
| Colombians | 82.2 /100 | #143 | Excellent 84.9% |
| Uruguayans | 78.5 /100 | #144 | Good 84.9% |
| Palestinians | 77.7 /100 | #145 | Good 84.9% |
| Immigrants | Saudi Arabia | 76.6 /100 | #146 | Good 84.9% |
| Immigrants | Colombia | 76.3 /100 | #147 | Good 84.9% |
| Immigrants | Pakistan | 76.2 /100 | #148 | Good 84.9% |
| Immigrants | Ukraine | 75.1 /100 | #149 | Good 84.8% |