Immigrants from Bosnia and Herzegovina vs German Single Mother Households
COMPARE
Immigrants from Bosnia and Herzegovina
German
Single Mother Households
Single Mother Households Comparison
Immigrants from Bosnia and Herzegovina
Germans
6.3%
SINGLE MOTHER HOUSEHOLDS
44.3/ 100
METRIC RATING
176th/ 347
METRIC RANK
5.8%
SINGLE MOTHER HOUSEHOLDS
96.2/ 100
METRIC RATING
101st/ 347
METRIC RANK
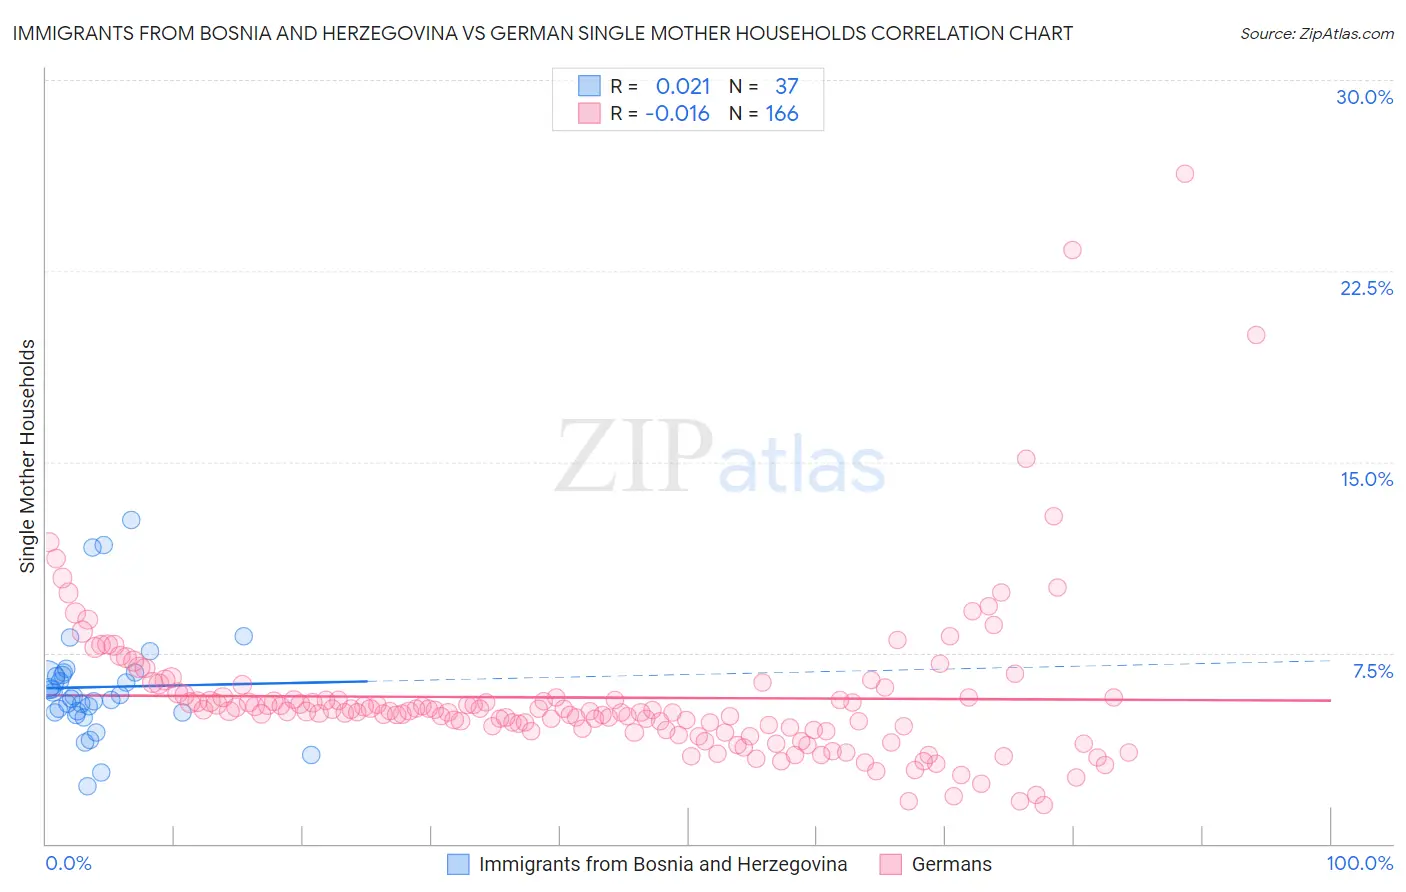
Immigrants from Bosnia and Herzegovina vs German Single Mother Households Correlation Chart
The statistical analysis conducted on geographies consisting of 156,750,530 people shows no correlation between the proportion of Immigrants from Bosnia and Herzegovina and percentage of single mother households in the United States with a correlation coefficient (R) of 0.021 and weighted average of 6.3%. Similarly, the statistical analysis conducted on geographies consisting of 574,074,235 people shows no correlation between the proportion of Germans and percentage of single mother households in the United States with a correlation coefficient (R) of -0.016 and weighted average of 5.8%, a difference of 10.4%.
Single Mother Households Correlation Summary
| Measurement | Immigrants from Bosnia and Herzegovina | German |
| Minimum | 2.3% | 1.5% |
| Maximum | 12.7% | 26.3% |
| Range | 10.4% | 24.8% |
| Mean | 6.2% | 5.7% |
| Median | 5.8% | 5.2% |
| Interquartile 25% (IQ1) | 5.1% | 4.5% |
| Interquartile 75% (IQ3) | 6.7% | 5.8% |
| Interquartile Range (IQR) | 1.5% | 1.3% |
| Standard Deviation (Sample) | 2.2% | 3.1% |
| Standard Deviation (Population) | 2.1% | 3.1% |
Similar Demographics by Single Mother Households
Demographics Similar to Immigrants from Bosnia and Herzegovina by Single Mother Households
In terms of single mother households, the demographic groups most similar to Immigrants from Bosnia and Herzegovina are Osage (6.4%, a difference of 0.14%), Marshallese (6.3%, a difference of 0.16%), Portuguese (6.4%, a difference of 0.49%), Hmong (6.4%, a difference of 0.51%), and Immigrants from Morocco (6.3%, a difference of 0.62%).
| Demographics | Rating | Rank | Single Mother Households |
| Puget Sound Salish | 58.1 /100 | #169 | Average 6.3% |
| Immigrants | Oceania | 54.6 /100 | #170 | Average 6.3% |
| Afghans | 52.5 /100 | #171 | Average 6.3% |
| Immigrants | South Eastern Asia | 52.2 /100 | #172 | Average 6.3% |
| Immigrants | Vietnam | 51.5 /100 | #173 | Average 6.3% |
| Immigrants | Morocco | 50.0 /100 | #174 | Average 6.3% |
| Marshallese | 45.8 /100 | #175 | Average 6.3% |
| Immigrants | Bosnia and Herzegovina | 44.3 /100 | #176 | Average 6.3% |
| Osage | 43.0 /100 | #177 | Average 6.4% |
| Portuguese | 40.0 /100 | #178 | Fair 6.4% |
| Hmong | 39.8 /100 | #179 | Fair 6.4% |
| Immigrants | Nepal | 36.1 /100 | #180 | Fair 6.4% |
| Spanish | 33.4 /100 | #181 | Fair 6.4% |
| South American Indians | 33.4 /100 | #182 | Fair 6.4% |
| Spaniards | 27.8 /100 | #183 | Fair 6.5% |
Demographics Similar to Germans by Single Mother Households
In terms of single mother households, the demographic groups most similar to Germans are English (5.8%, a difference of 0.0%), Scottish (5.8%, a difference of 0.020%), Scandinavian (5.8%, a difference of 0.030%), Northern European (5.8%, a difference of 0.030%), and Immigrants from Poland (5.8%, a difference of 0.040%).
| Demographics | Rating | Rank | Single Mother Households |
| Basques | 96.7 /100 | #94 | Exceptional 5.7% |
| Slovaks | 96.6 /100 | #95 | Exceptional 5.7% |
| Austrians | 96.4 /100 | #96 | Exceptional 5.7% |
| Tlingit-Haida | 96.4 /100 | #97 | Exceptional 5.7% |
| Immigrants | South Africa | 96.3 /100 | #98 | Exceptional 5.7% |
| Immigrants | Poland | 96.3 /100 | #99 | Exceptional 5.8% |
| Scandinavians | 96.2 /100 | #100 | Exceptional 5.8% |
| Germans | 96.2 /100 | #101 | Exceptional 5.8% |
| English | 96.2 /100 | #102 | Exceptional 5.8% |
| Scottish | 96.2 /100 | #103 | Exceptional 5.8% |
| Northern Europeans | 96.2 /100 | #104 | Exceptional 5.8% |
| Taiwanese | 96.1 /100 | #105 | Exceptional 5.8% |
| Immigrants | Ukraine | 95.9 /100 | #106 | Exceptional 5.8% |
| Paraguayans | 95.8 /100 | #107 | Exceptional 5.8% |
| Immigrants | Italy | 95.8 /100 | #108 | Exceptional 5.8% |