Immigrants from Belgium vs Yaqui In Labor Force | Age > 16
COMPARE
Immigrants from Belgium
Yaqui
In Labor Force | Age > 16
In Labor Force | Age > 16 Comparison
Immigrants from Belgium
Yaqui
64.9%
IN LABOR FORCE | AGE > 16
19.4/ 100
METRIC RATING
202nd/ 347
METRIC RANK
63.0%
IN LABOR FORCE | AGE > 16
0.0/ 100
METRIC RATING
314th/ 347
METRIC RANK
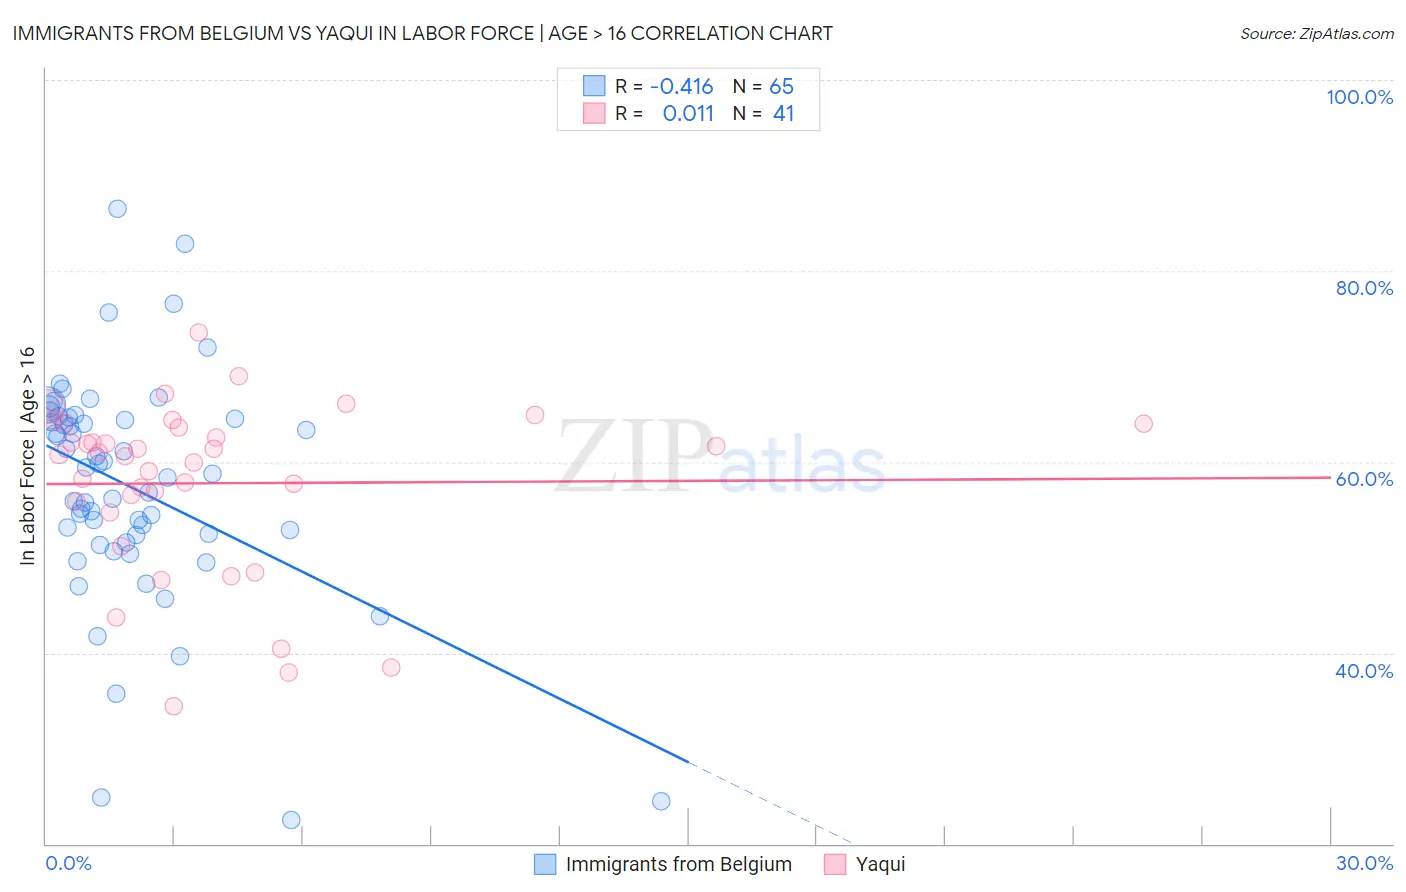
Immigrants from Belgium vs Yaqui In Labor Force | Age > 16 Correlation Chart
The statistical analysis conducted on geographies consisting of 146,728,908 people shows a moderate negative correlation between the proportion of Immigrants from Belgium and labor force participation rate among population ages 16 and over in the United States with a correlation coefficient (R) of -0.416 and weighted average of 64.9%. Similarly, the statistical analysis conducted on geographies consisting of 107,721,250 people shows no correlation between the proportion of Yaqui and labor force participation rate among population ages 16 and over in the United States with a correlation coefficient (R) of 0.011 and weighted average of 63.0%, a difference of 2.9%.
In Labor Force | Age > 16 Correlation Summary
| Measurement | Immigrants from Belgium | Yaqui |
| Minimum | 22.5% | 34.4% |
| Maximum | 86.5% | 73.5% |
| Range | 64.0% | 39.1% |
| Mean | 57.3% | 57.8% |
| Median | 58.8% | 60.7% |
| Interquartile 25% (IQ1) | 52.0% | 55.3% |
| Interquartile 75% (IQ3) | 64.6% | 63.8% |
| Interquartile Range (IQR) | 12.6% | 8.5% |
| Standard Deviation (Sample) | 11.9% | 8.9% |
| Standard Deviation (Population) | 11.8% | 8.8% |
Similar Demographics by In Labor Force | Age > 16
Demographics Similar to Immigrants from Belgium by In Labor Force | Age > 16
In terms of in labor force | age > 16, the demographic groups most similar to Immigrants from Belgium are Ukrainian (64.9%, a difference of 0.0%), Russian (64.9%, a difference of 0.010%), Slovene (64.9%, a difference of 0.010%), Jamaican (64.9%, a difference of 0.010%), and Armenian (64.9%, a difference of 0.020%).
| Demographics | Rating | Rank | In Labor Force | Age > 16 |
| Romanians | 31.1 /100 | #195 | Fair 65.0% |
| Haitians | 30.6 /100 | #196 | Fair 65.0% |
| Immigrants | Italy | 28.7 /100 | #197 | Fair 65.0% |
| Greeks | 26.1 /100 | #198 | Fair 64.9% |
| Mexican American Indians | 23.1 /100 | #199 | Fair 64.9% |
| Armenians | 20.2 /100 | #200 | Fair 64.9% |
| Ukrainians | 19.6 /100 | #201 | Poor 64.9% |
| Immigrants | Belgium | 19.4 /100 | #202 | Poor 64.9% |
| Russians | 18.8 /100 | #203 | Poor 64.9% |
| Slovenes | 18.7 /100 | #204 | Poor 64.9% |
| Jamaicans | 18.7 /100 | #205 | Poor 64.9% |
| Lithuanians | 17.4 /100 | #206 | Poor 64.8% |
| Immigrants | Latin America | 16.4 /100 | #207 | Poor 64.8% |
| Belizeans | 16.2 /100 | #208 | Poor 64.8% |
| Immigrants | Trinidad and Tobago | 15.6 /100 | #209 | Poor 64.8% |
Demographics Similar to Yaqui by In Labor Force | Age > 16
In terms of in labor force | age > 16, the demographic groups most similar to Yaqui are Chippewa (63.1%, a difference of 0.10%), Iroquois (63.2%, a difference of 0.23%), Blackfeet (63.2%, a difference of 0.29%), Shoshone (63.2%, a difference of 0.30%), and Potawatomi (62.8%, a difference of 0.35%).
| Demographics | Rating | Rank | In Labor Force | Age > 16 |
| Central American Indians | 0.0 /100 | #307 | Tragic 63.4% |
| Pennsylvania Germans | 0.0 /100 | #308 | Tragic 63.4% |
| Scotch-Irish | 0.0 /100 | #309 | Tragic 63.3% |
| Shoshone | 0.0 /100 | #310 | Tragic 63.2% |
| Blackfeet | 0.0 /100 | #311 | Tragic 63.2% |
| Iroquois | 0.0 /100 | #312 | Tragic 63.2% |
| Chippewa | 0.0 /100 | #313 | Tragic 63.1% |
| Yaqui | 0.0 /100 | #314 | Tragic 63.0% |
| Potawatomi | 0.0 /100 | #315 | Tragic 62.8% |
| Yup'ik | 0.0 /100 | #316 | Tragic 62.7% |
| Kiowa | 0.0 /100 | #317 | Tragic 62.4% |
| Chickasaw | 0.0 /100 | #318 | Tragic 62.3% |
| Arapaho | 0.0 /100 | #319 | Tragic 62.1% |
| Yakama | 0.0 /100 | #320 | Tragic 62.1% |
| Americans | 0.0 /100 | #321 | Tragic 62.1% |