Immigrants from Belgium vs Yaqui Unemployment Among Women with Children Ages 6 to 17 years
COMPARE
Immigrants from Belgium
Yaqui
Unemployment Among Women with Children Ages 6 to 17 years
Unemployment Among Women with Children Ages 6 to 17 years Comparison
Immigrants from Belgium
Yaqui
8.9%
UNEMPLOYMENT AMONG WOMEN WITH CHILDREN AGES 6 TO 17 YEARS
65.6/ 100
METRIC RATING
157th/ 347
METRIC RANK
8.7%
UNEMPLOYMENT AMONG WOMEN WITH CHILDREN AGES 6 TO 17 YEARS
92.2/ 100
METRIC RATING
132nd/ 347
METRIC RANK
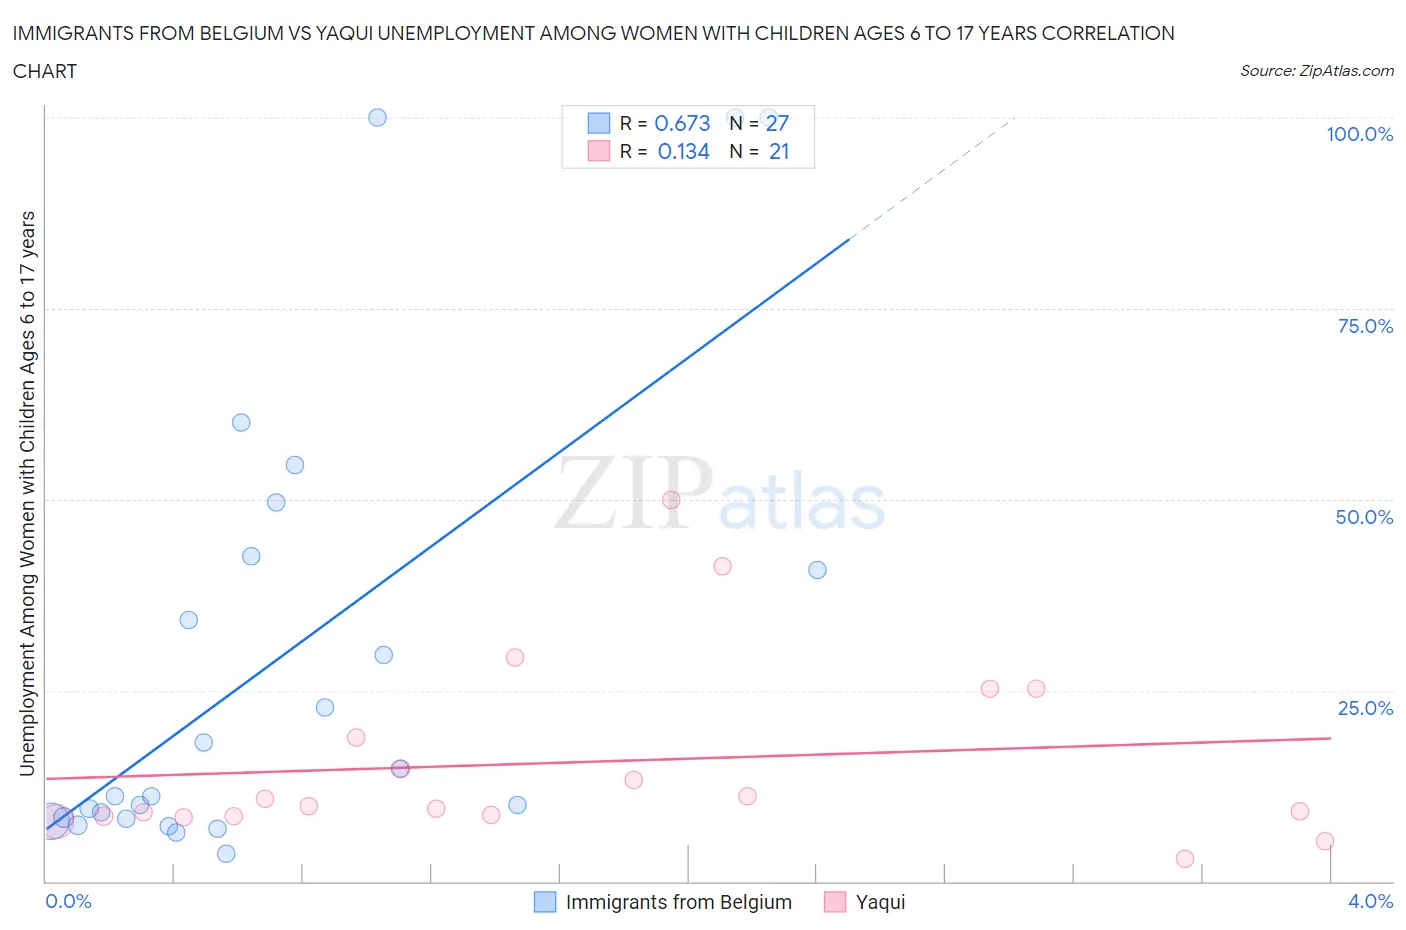
Immigrants from Belgium vs Yaqui Unemployment Among Women with Children Ages 6 to 17 years Correlation Chart
The statistical analysis conducted on geographies consisting of 120,848,213 people shows a significant positive correlation between the proportion of Immigrants from Belgium and unemployment rate among women with children between the ages 6 and 17 in the United States with a correlation coefficient (R) of 0.673 and weighted average of 8.9%. Similarly, the statistical analysis conducted on geographies consisting of 95,121,175 people shows a poor positive correlation between the proportion of Yaqui and unemployment rate among women with children between the ages 6 and 17 in the United States with a correlation coefficient (R) of 0.134 and weighted average of 8.7%, a difference of 2.1%.
Unemployment Among Women with Children Ages 6 to 17 years Correlation Summary
| Measurement | Immigrants from Belgium | Yaqui |
| Minimum | 3.7% | 2.9% |
| Maximum | 100.0% | 50.0% |
| Range | 96.3% | 47.1% |
| Mean | 29.0% | 15.6% |
| Median | 11.1% | 9.8% |
| Interquartile 25% (IQ1) | 8.2% | 8.5% |
| Interquartile 75% (IQ3) | 42.5% | 22.0% |
| Interquartile Range (IQR) | 34.3% | 13.5% |
| Standard Deviation (Sample) | 30.3% | 12.2% |
| Standard Deviation (Population) | 29.8% | 11.9% |
Similar Demographics by Unemployment Among Women with Children Ages 6 to 17 years
Demographics Similar to Immigrants from Belgium by Unemployment Among Women with Children Ages 6 to 17 years
In terms of unemployment among women with children ages 6 to 17 years, the demographic groups most similar to Immigrants from Belgium are Osage (8.9%, a difference of 0.010%), Immigrants from Chile (8.9%, a difference of 0.010%), Spanish (8.9%, a difference of 0.090%), Immigrants from Hungary (8.9%, a difference of 0.11%), and Immigrants from Guyana (8.9%, a difference of 0.13%).
| Demographics | Rating | Rank | Unemployment Among Women with Children Ages 6 to 17 years |
| Greeks | 75.2 /100 | #150 | Good 8.9% |
| Immigrants | Eastern Africa | 74.6 /100 | #151 | Good 8.9% |
| Immigrants | Northern Europe | 74.6 /100 | #152 | Good 8.9% |
| Immigrants | Europe | 73.4 /100 | #153 | Good 8.9% |
| Vietnamese | 72.1 /100 | #154 | Good 8.9% |
| Immigrants | Greece | 71.8 /100 | #155 | Good 8.9% |
| Osage | 65.9 /100 | #156 | Good 8.9% |
| Immigrants | Belgium | 65.6 /100 | #157 | Good 8.9% |
| Immigrants | Chile | 65.3 /100 | #158 | Good 8.9% |
| Spanish | 63.8 /100 | #159 | Good 8.9% |
| Immigrants | Hungary | 63.4 /100 | #160 | Good 8.9% |
| Immigrants | Guyana | 63.0 /100 | #161 | Good 8.9% |
| Immigrants | Netherlands | 60.8 /100 | #162 | Good 8.9% |
| Mexican American Indians | 60.6 /100 | #163 | Good 8.9% |
| Ukrainians | 59.7 /100 | #164 | Average 8.9% |
Demographics Similar to Yaqui by Unemployment Among Women with Children Ages 6 to 17 years
In terms of unemployment among women with children ages 6 to 17 years, the demographic groups most similar to Yaqui are Slavic (8.7%, a difference of 0.010%), Egyptian (8.7%, a difference of 0.060%), Immigrants from Western Asia (8.7%, a difference of 0.16%), Immigrants from Ireland (8.7%, a difference of 0.17%), and European (8.7%, a difference of 0.23%).
| Demographics | Rating | Rank | Unemployment Among Women with Children Ages 6 to 17 years |
| South Africans | 94.6 /100 | #125 | Exceptional 8.7% |
| Immigrants | Northern Africa | 94.4 /100 | #126 | Exceptional 8.7% |
| Czechs | 94.4 /100 | #127 | Exceptional 8.7% |
| Hmong | 94.3 /100 | #128 | Exceptional 8.7% |
| Barbadians | 93.8 /100 | #129 | Exceptional 8.7% |
| Immigrants | Western Asia | 93.1 /100 | #130 | Exceptional 8.7% |
| Slavs | 92.2 /100 | #131 | Exceptional 8.7% |
| Yaqui | 92.2 /100 | #132 | Exceptional 8.7% |
| Egyptians | 91.8 /100 | #133 | Exceptional 8.7% |
| Immigrants | Ireland | 91.0 /100 | #134 | Exceptional 8.7% |
| Europeans | 90.6 /100 | #135 | Exceptional 8.7% |
| Immigrants | Latvia | 90.4 /100 | #136 | Exceptional 8.7% |
| Immigrants | Argentina | 90.0 /100 | #137 | Excellent 8.7% |
| Immigrants | Ethiopia | 89.5 /100 | #138 | Excellent 8.8% |
| Northern Europeans | 89.2 /100 | #139 | Excellent 8.8% |