Immigrants from Belgium vs Seminole In Labor Force | Age > 16
COMPARE
Immigrants from Belgium
Seminole
In Labor Force | Age > 16
In Labor Force | Age > 16 Comparison
Immigrants from Belgium
Seminole
64.9%
IN LABOR FORCE | AGE > 16
19.4/ 100
METRIC RATING
202nd/ 347
METRIC RANK
62.0%
IN LABOR FORCE | AGE > 16
0.0/ 100
METRIC RATING
323rd/ 347
METRIC RANK
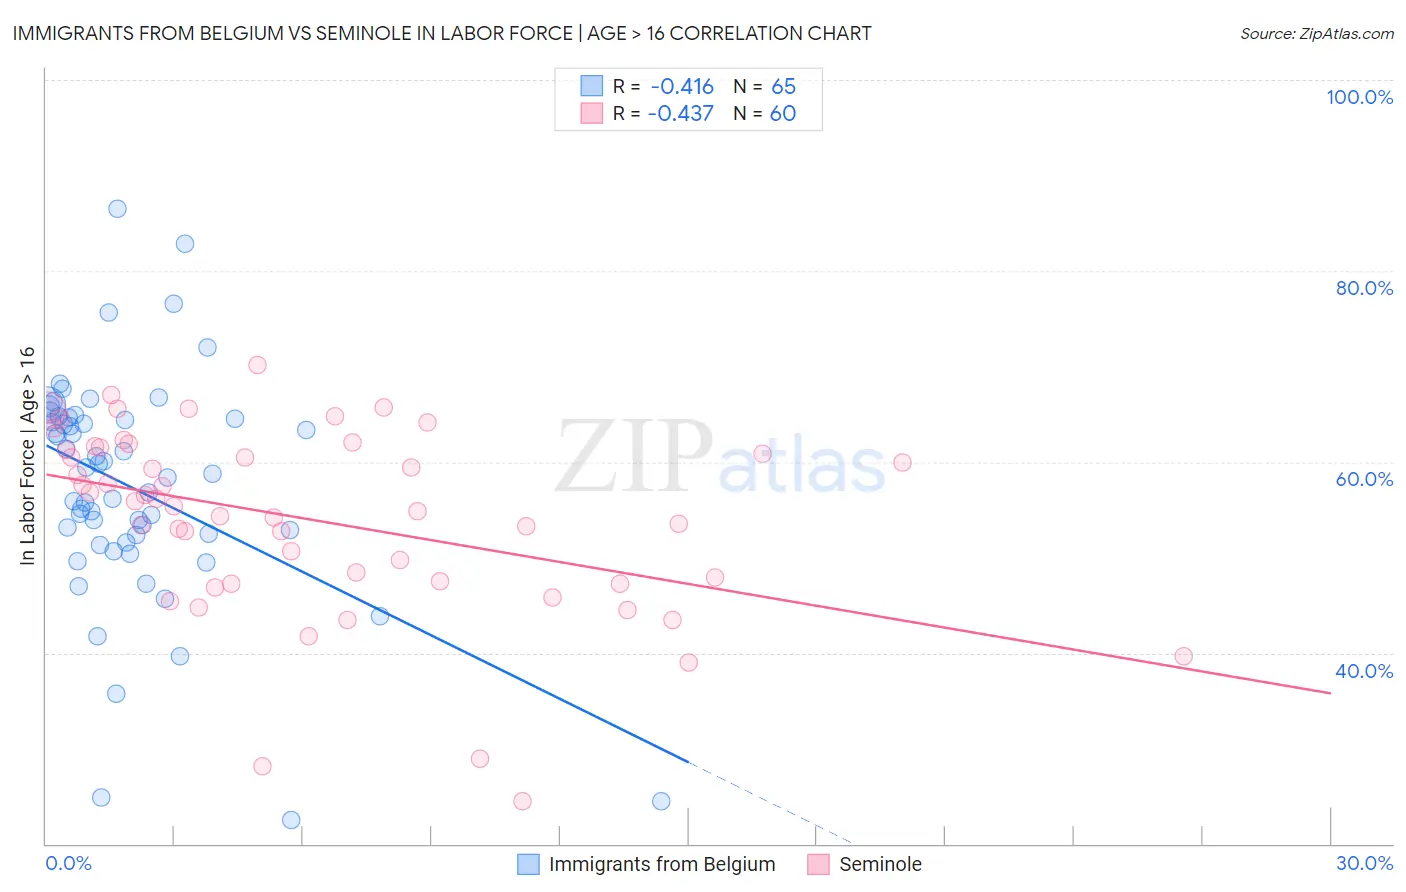
Immigrants from Belgium vs Seminole In Labor Force | Age > 16 Correlation Chart
The statistical analysis conducted on geographies consisting of 146,728,908 people shows a moderate negative correlation between the proportion of Immigrants from Belgium and labor force participation rate among population ages 16 and over in the United States with a correlation coefficient (R) of -0.416 and weighted average of 64.9%. Similarly, the statistical analysis conducted on geographies consisting of 118,310,187 people shows a moderate negative correlation between the proportion of Seminole and labor force participation rate among population ages 16 and over in the United States with a correlation coefficient (R) of -0.437 and weighted average of 62.0%, a difference of 4.6%.
In Labor Force | Age > 16 Correlation Summary
| Measurement | Immigrants from Belgium | Seminole |
| Minimum | 22.5% | 24.4% |
| Maximum | 86.5% | 70.1% |
| Range | 64.0% | 45.7% |
| Mean | 57.3% | 53.9% |
| Median | 58.8% | 55.6% |
| Interquartile 25% (IQ1) | 52.0% | 47.4% |
| Interquartile 75% (IQ3) | 64.6% | 61.4% |
| Interquartile Range (IQR) | 12.6% | 14.1% |
| Standard Deviation (Sample) | 11.9% | 9.8% |
| Standard Deviation (Population) | 11.8% | 9.7% |
Similar Demographics by In Labor Force | Age > 16
Demographics Similar to Immigrants from Belgium by In Labor Force | Age > 16
In terms of in labor force | age > 16, the demographic groups most similar to Immigrants from Belgium are Ukrainian (64.9%, a difference of 0.0%), Russian (64.9%, a difference of 0.010%), Slovene (64.9%, a difference of 0.010%), Jamaican (64.9%, a difference of 0.010%), and Armenian (64.9%, a difference of 0.020%).
| Demographics | Rating | Rank | In Labor Force | Age > 16 |
| Romanians | 31.1 /100 | #195 | Fair 65.0% |
| Haitians | 30.6 /100 | #196 | Fair 65.0% |
| Immigrants | Italy | 28.7 /100 | #197 | Fair 65.0% |
| Greeks | 26.1 /100 | #198 | Fair 64.9% |
| Mexican American Indians | 23.1 /100 | #199 | Fair 64.9% |
| Armenians | 20.2 /100 | #200 | Fair 64.9% |
| Ukrainians | 19.6 /100 | #201 | Poor 64.9% |
| Immigrants | Belgium | 19.4 /100 | #202 | Poor 64.9% |
| Russians | 18.8 /100 | #203 | Poor 64.9% |
| Slovenes | 18.7 /100 | #204 | Poor 64.9% |
| Jamaicans | 18.7 /100 | #205 | Poor 64.9% |
| Lithuanians | 17.4 /100 | #206 | Poor 64.8% |
| Immigrants | Latin America | 16.4 /100 | #207 | Poor 64.8% |
| Belizeans | 16.2 /100 | #208 | Poor 64.8% |
| Immigrants | Trinidad and Tobago | 15.6 /100 | #209 | Poor 64.8% |
Demographics Similar to Seminole by In Labor Force | Age > 16
In terms of in labor force | age > 16, the demographic groups most similar to Seminole are Ottawa (62.0%, a difference of 0.030%), Cheyenne (62.0%, a difference of 0.040%), Cherokee (61.9%, a difference of 0.090%), American (62.1%, a difference of 0.18%), and Arapaho (62.1%, a difference of 0.22%).
| Demographics | Rating | Rank | In Labor Force | Age > 16 |
| Yup'ik | 0.0 /100 | #316 | Tragic 62.7% |
| Kiowa | 0.0 /100 | #317 | Tragic 62.4% |
| Chickasaw | 0.0 /100 | #318 | Tragic 62.3% |
| Arapaho | 0.0 /100 | #319 | Tragic 62.1% |
| Yakama | 0.0 /100 | #320 | Tragic 62.1% |
| Americans | 0.0 /100 | #321 | Tragic 62.1% |
| Ottawa | 0.0 /100 | #322 | Tragic 62.0% |
| Seminole | 0.0 /100 | #323 | Tragic 62.0% |
| Cheyenne | 0.0 /100 | #324 | Tragic 62.0% |
| Cherokee | 0.0 /100 | #325 | Tragic 61.9% |
| Sioux | 0.0 /100 | #326 | Tragic 61.8% |
| Cajuns | 0.0 /100 | #327 | Tragic 61.8% |
| Dutch West Indians | 0.0 /100 | #328 | Tragic 61.7% |
| Choctaw | 0.0 /100 | #329 | Tragic 61.5% |
| Creek | 0.0 /100 | #330 | Tragic 61.3% |