Immigrants from Belarus vs Scottish In Labor Force | Age 35-44
COMPARE
Immigrants from Belarus
Scottish
In Labor Force | Age 35-44
In Labor Force | Age 35-44 Comparison
Immigrants from Belarus
Scottish
84.8%
IN LABOR FORCE | AGE 35-44
95.3/ 100
METRIC RATING
103rd/ 347
METRIC RANK
83.9%
IN LABOR FORCE | AGE 35-44
3.2/ 100
METRIC RATING
231st/ 347
METRIC RANK
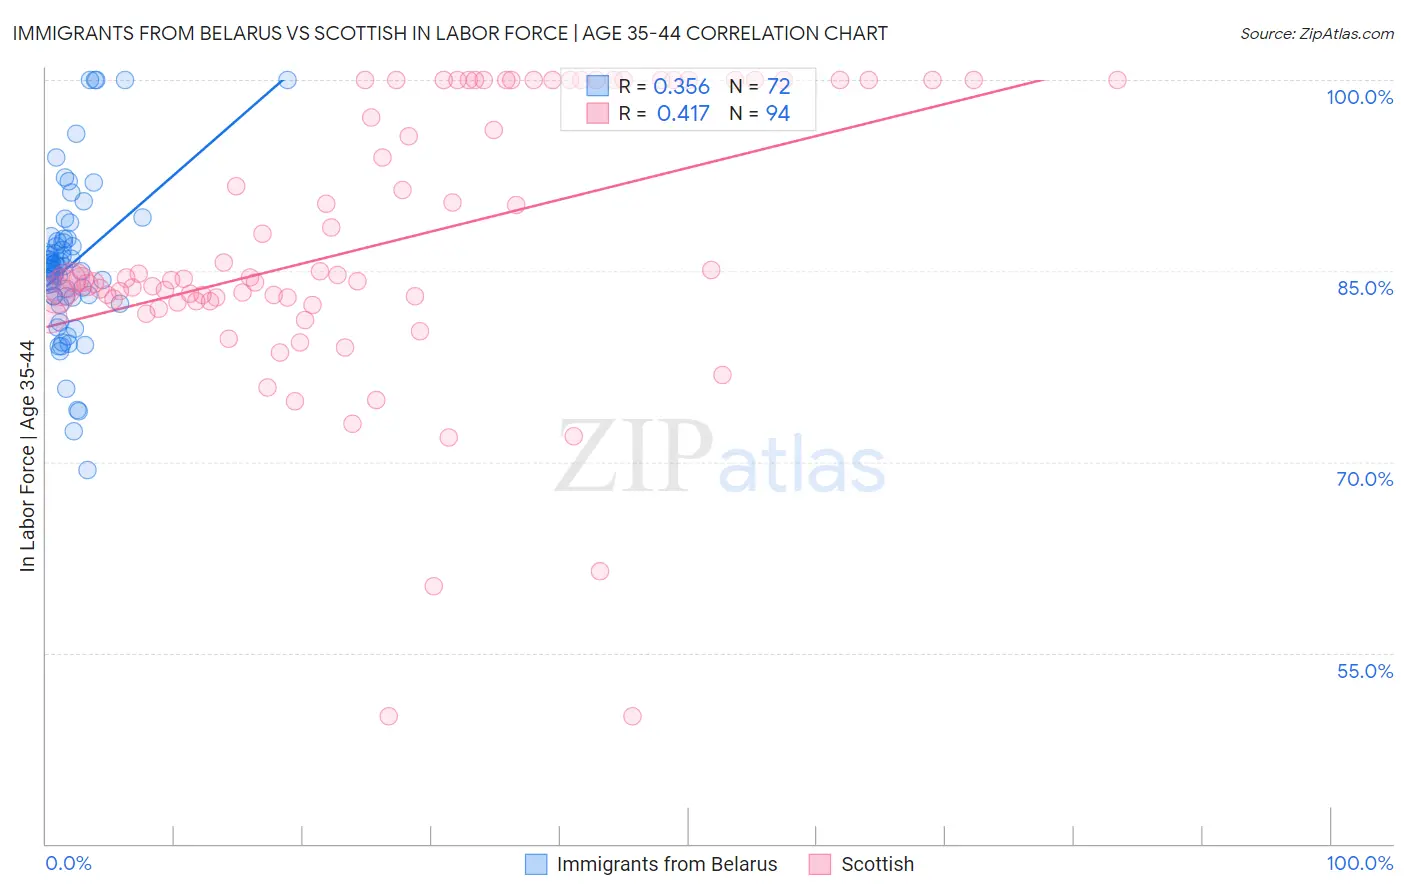
Immigrants from Belarus vs Scottish In Labor Force | Age 35-44 Correlation Chart
The statistical analysis conducted on geographies consisting of 150,195,638 people shows a mild positive correlation between the proportion of Immigrants from Belarus and labor force participation rate among population between the ages 35 and 44 in the United States with a correlation coefficient (R) of 0.356 and weighted average of 84.8%. Similarly, the statistical analysis conducted on geographies consisting of 566,464,566 people shows a moderate positive correlation between the proportion of Scottish and labor force participation rate among population between the ages 35 and 44 in the United States with a correlation coefficient (R) of 0.417 and weighted average of 83.9%, a difference of 1.0%.
In Labor Force | Age 35-44 Correlation Summary
| Measurement | Immigrants from Belarus | Scottish |
| Minimum | 69.4% | 50.0% |
| Maximum | 100.0% | 100.0% |
| Range | 30.6% | 50.0% |
| Mean | 85.5% | 87.1% |
| Median | 85.3% | 84.4% |
| Interquartile 25% (IQ1) | 82.9% | 82.6% |
| Interquartile 75% (IQ3) | 87.4% | 100.0% |
| Interquartile Range (IQR) | 4.5% | 17.4% |
| Standard Deviation (Sample) | 6.1% | 10.9% |
| Standard Deviation (Population) | 6.1% | 10.8% |
Similar Demographics by In Labor Force | Age 35-44
Demographics Similar to Immigrants from Belarus by In Labor Force | Age 35-44
In terms of in labor force | age 35-44, the demographic groups most similar to Immigrants from Belarus are Immigrants from Southern Europe (84.8%, a difference of 0.0%), Immigrants from Sweden (84.8%, a difference of 0.0%), Immigrants from Australia (84.8%, a difference of 0.010%), South American (84.8%, a difference of 0.010%), and Immigrants from Bahamas (84.8%, a difference of 0.010%).
| Demographics | Rating | Rank | In Labor Force | Age 35-44 |
| Cubans | 96.6 /100 | #96 | Exceptional 84.8% |
| Egyptians | 96.6 /100 | #97 | Exceptional 84.8% |
| Indians (Asian) | 96.1 /100 | #98 | Exceptional 84.8% |
| Haitians | 96.0 /100 | #99 | Exceptional 84.8% |
| Immigrants | Czechoslovakia | 95.9 /100 | #100 | Exceptional 84.8% |
| Immigrants | Australia | 95.5 /100 | #101 | Exceptional 84.8% |
| Immigrants | Southern Europe | 95.3 /100 | #102 | Exceptional 84.8% |
| Immigrants | Belarus | 95.3 /100 | #103 | Exceptional 84.8% |
| Immigrants | Sweden | 95.2 /100 | #104 | Exceptional 84.8% |
| South Americans | 95.0 /100 | #105 | Exceptional 84.8% |
| Immigrants | Bahamas | 94.8 /100 | #106 | Exceptional 84.8% |
| Immigrants | Romania | 94.7 /100 | #107 | Exceptional 84.8% |
| Immigrants | Argentina | 94.5 /100 | #108 | Exceptional 84.8% |
| Immigrants | Russia | 94.5 /100 | #109 | Exceptional 84.8% |
| Filipinos | 93.8 /100 | #110 | Exceptional 84.7% |
Demographics Similar to Scottish by In Labor Force | Age 35-44
In terms of in labor force | age 35-44, the demographic groups most similar to Scottish are Native Hawaiian (83.9%, a difference of 0.010%), Immigrants from Germany (83.9%, a difference of 0.020%), Immigrants from Iraq (83.9%, a difference of 0.030%), Immigrants from Oceania (83.9%, a difference of 0.030%), and Immigrants from Syria (83.9%, a difference of 0.040%).
| Demographics | Rating | Rank | In Labor Force | Age 35-44 |
| U.S. Virgin Islanders | 6.1 /100 | #224 | Tragic 84.0% |
| Immigrants | Burma/Myanmar | 6.1 /100 | #225 | Tragic 84.0% |
| Panamanians | 5.4 /100 | #226 | Tragic 84.0% |
| British West Indians | 5.3 /100 | #227 | Tragic 84.0% |
| Welsh | 5.3 /100 | #228 | Tragic 84.0% |
| Immigrants | Thailand | 4.7 /100 | #229 | Tragic 84.0% |
| Immigrants | Iraq | 3.7 /100 | #230 | Tragic 83.9% |
| Scottish | 3.2 /100 | #231 | Tragic 83.9% |
| Native Hawaiians | 3.0 /100 | #232 | Tragic 83.9% |
| Immigrants | Germany | 2.8 /100 | #233 | Tragic 83.9% |
| Immigrants | Oceania | 2.6 /100 | #234 | Tragic 83.9% |
| Immigrants | Syria | 2.5 /100 | #235 | Tragic 83.9% |
| West Indians | 2.4 /100 | #236 | Tragic 83.9% |
| English | 1.8 /100 | #237 | Tragic 83.8% |
| Immigrants | Laos | 1.7 /100 | #238 | Tragic 83.8% |