Immigrants from Belarus vs Scottish Master's Degree
COMPARE
Immigrants from Belarus
Scottish
Master's Degree
Master's Degree Comparison
Immigrants from Belarus
Scottish
18.9%
MASTER'S DEGREE
100.0/ 100
METRIC RATING
45th/ 347
METRIC RANK
15.2%
MASTER'S DEGREE
62.7/ 100
METRIC RATING
169th/ 347
METRIC RANK
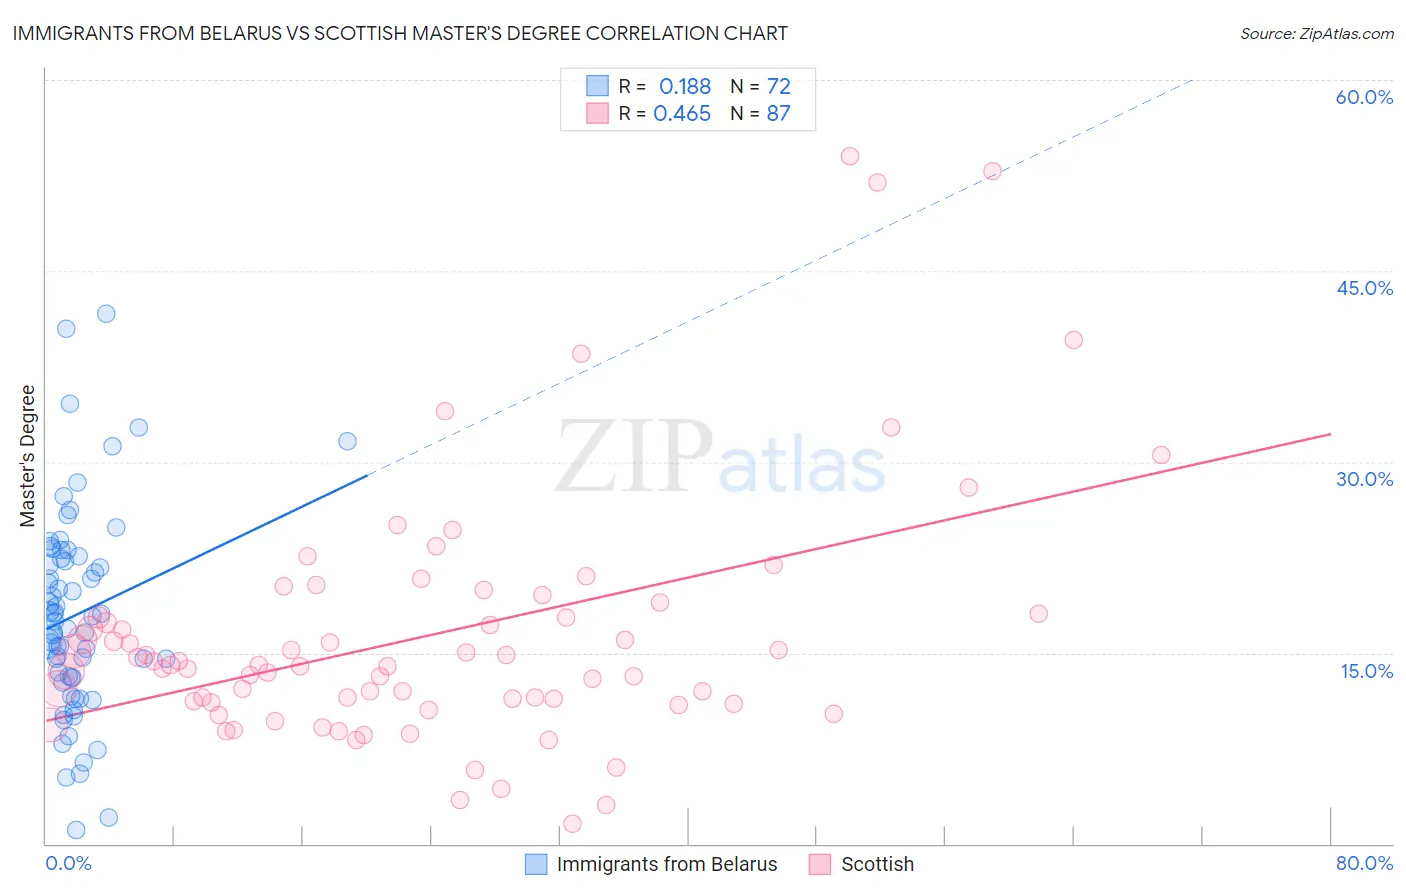
Immigrants from Belarus vs Scottish Master's Degree Correlation Chart
The statistical analysis conducted on geographies consisting of 150,177,035 people shows a poor positive correlation between the proportion of Immigrants from Belarus and percentage of population with at least master's degree education in the United States with a correlation coefficient (R) of 0.188 and weighted average of 18.9%. Similarly, the statistical analysis conducted on geographies consisting of 566,344,578 people shows a moderate positive correlation between the proportion of Scottish and percentage of population with at least master's degree education in the United States with a correlation coefficient (R) of 0.465 and weighted average of 15.2%, a difference of 24.6%.
Master's Degree Correlation Summary
| Measurement | Immigrants from Belarus | Scottish |
| Minimum | 1.1% | 1.6% |
| Maximum | 41.7% | 54.0% |
| Range | 40.6% | 52.4% |
| Mean | 18.0% | 16.4% |
| Median | 17.7% | 14.0% |
| Interquartile 25% (IQ1) | 13.0% | 11.1% |
| Interquartile 75% (IQ3) | 22.5% | 18.0% |
| Interquartile Range (IQR) | 9.5% | 7.0% |
| Standard Deviation (Sample) | 8.0% | 9.9% |
| Standard Deviation (Population) | 7.9% | 9.8% |
Similar Demographics by Master's Degree
Demographics Similar to Immigrants from Belarus by Master's Degree
In terms of master's degree, the demographic groups most similar to Immigrants from Belarus are Immigrants from Malaysia (18.9%, a difference of 0.11%), Immigrants from Norway (18.8%, a difference of 0.38%), Immigrants from Greece (19.0%, a difference of 0.39%), Immigrants from Saudi Arabia (19.0%, a difference of 0.40%), and Immigrants from Austria (18.8%, a difference of 0.40%).
| Demographics | Rating | Rank | Master's Degree |
| Bolivians | 100.0 /100 | #38 | Exceptional 19.3% |
| Immigrants | Spain | 100.0 /100 | #39 | Exceptional 19.1% |
| Immigrants | Bolivia | 100.0 /100 | #40 | Exceptional 19.1% |
| Immigrants | Latvia | 100.0 /100 | #41 | Exceptional 19.1% |
| Immigrants | Saudi Arabia | 100.0 /100 | #42 | Exceptional 19.0% |
| Immigrants | Greece | 100.0 /100 | #43 | Exceptional 19.0% |
| Immigrants | Malaysia | 100.0 /100 | #44 | Exceptional 18.9% |
| Immigrants | Belarus | 100.0 /100 | #45 | Exceptional 18.9% |
| Immigrants | Norway | 100.0 /100 | #46 | Exceptional 18.8% |
| Immigrants | Austria | 100.0 /100 | #47 | Exceptional 18.8% |
| Paraguayans | 100.0 /100 | #48 | Exceptional 18.8% |
| Estonians | 100.0 /100 | #49 | Exceptional 18.8% |
| Bulgarians | 100.0 /100 | #50 | Exceptional 18.8% |
| Immigrants | South Africa | 100.0 /100 | #51 | Exceptional 18.8% |
| Immigrants | Kuwait | 100.0 /100 | #52 | Exceptional 18.6% |
Demographics Similar to Scottish by Master's Degree
In terms of master's degree, the demographic groups most similar to Scottish are Immigrants from North Macedonia (15.2%, a difference of 0.25%), Senegalese (15.2%, a difference of 0.39%), Swedish (15.2%, a difference of 0.46%), Immigrants from Kenya (15.3%, a difference of 0.54%), and Colombian (15.3%, a difference of 0.58%).
| Demographics | Rating | Rank | Master's Degree |
| Peruvians | 68.7 /100 | #162 | Good 15.3% |
| Uruguayans | 67.1 /100 | #163 | Good 15.3% |
| Colombians | 66.9 /100 | #164 | Good 15.3% |
| Immigrants | Kenya | 66.6 /100 | #165 | Good 15.3% |
| Swedes | 66.1 /100 | #166 | Good 15.2% |
| Senegalese | 65.6 /100 | #167 | Good 15.2% |
| Immigrants | North Macedonia | 64.5 /100 | #168 | Good 15.2% |
| Scottish | 62.7 /100 | #169 | Good 15.2% |
| Irish | 56.3 /100 | #170 | Average 15.0% |
| Immigrants | Ghana | 53.6 /100 | #171 | Average 15.0% |
| Immigrants | Uruguay | 52.8 /100 | #172 | Average 15.0% |
| Costa Ricans | 52.5 /100 | #173 | Average 15.0% |
| Slovaks | 50.0 /100 | #174 | Average 14.9% |
| Immigrants | Peru | 49.6 /100 | #175 | Average 14.9% |
| Nigerians | 48.6 /100 | #176 | Average 14.9% |