Immigrants from Belarus vs Immigrants from Western Europe In Labor Force | Age 35-44
COMPARE
Immigrants from Belarus
Immigrants from Western Europe
In Labor Force | Age 35-44
In Labor Force | Age 35-44 Comparison
Immigrants from Belarus
Immigrants from Western Europe
84.8%
IN LABOR FORCE | AGE 35-44
95.3/ 100
METRIC RATING
103rd/ 347
METRIC RANK
84.2%
IN LABOR FORCE | AGE 35-44
24.7/ 100
METRIC RATING
197th/ 347
METRIC RANK
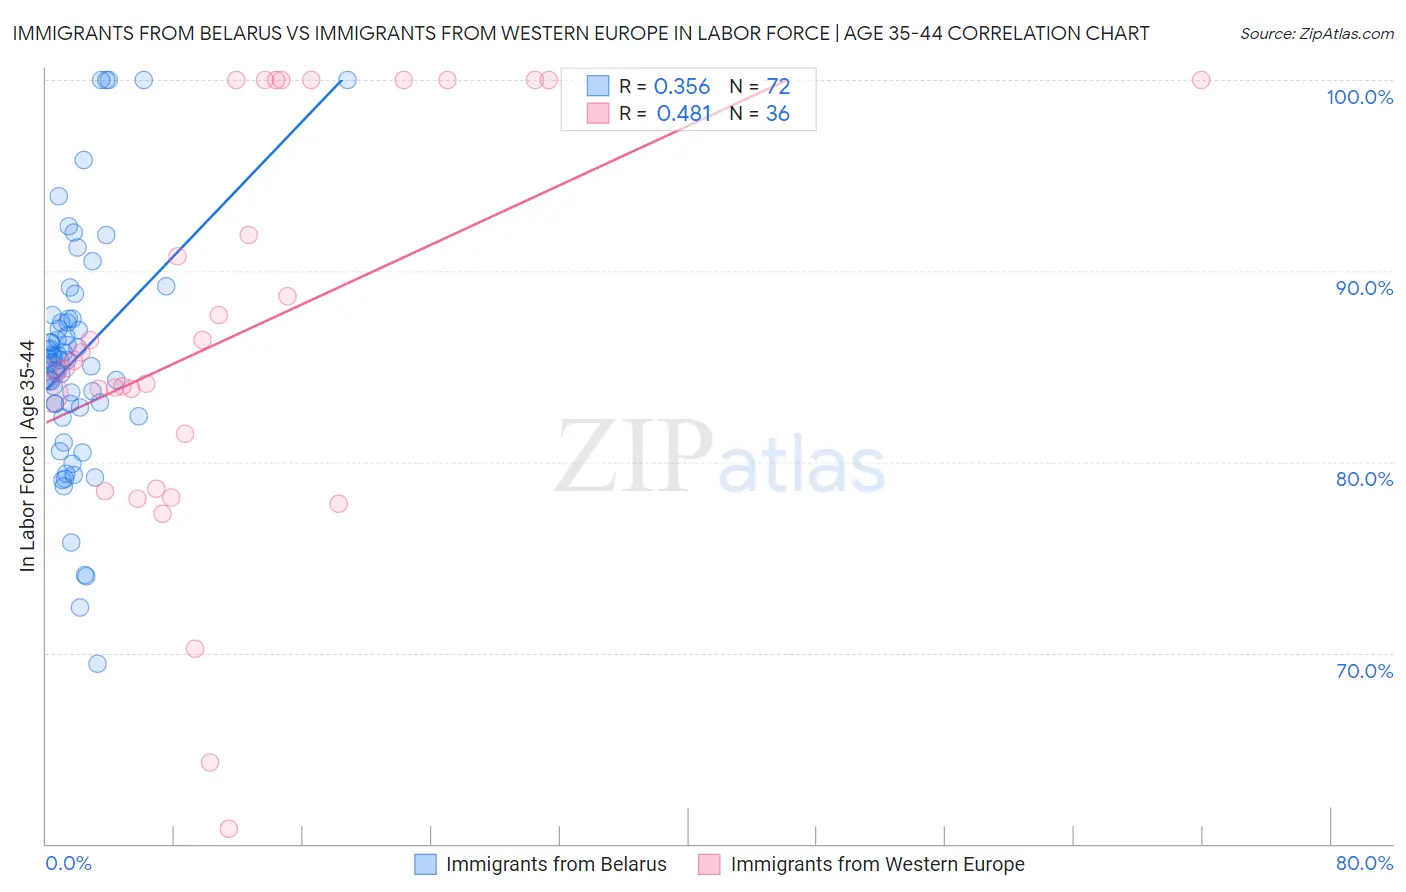
Immigrants from Belarus vs Immigrants from Western Europe In Labor Force | Age 35-44 Correlation Chart
The statistical analysis conducted on geographies consisting of 150,195,638 people shows a mild positive correlation between the proportion of Immigrants from Belarus and labor force participation rate among population between the ages 35 and 44 in the United States with a correlation coefficient (R) of 0.356 and weighted average of 84.8%. Similarly, the statistical analysis conducted on geographies consisting of 493,820,556 people shows a moderate positive correlation between the proportion of Immigrants from Western Europe and labor force participation rate among population between the ages 35 and 44 in the United States with a correlation coefficient (R) of 0.481 and weighted average of 84.2%, a difference of 0.67%.
In Labor Force | Age 35-44 Correlation Summary
| Measurement | Immigrants from Belarus | Immigrants from Western Europe |
| Minimum | 69.4% | 60.8% |
| Maximum | 100.0% | 100.0% |
| Range | 30.6% | 39.2% |
| Mean | 85.5% | 86.7% |
| Median | 85.3% | 85.1% |
| Interquartile 25% (IQ1) | 82.9% | 80.1% |
| Interquartile 75% (IQ3) | 87.4% | 100.0% |
| Interquartile Range (IQR) | 4.5% | 19.9% |
| Standard Deviation (Sample) | 6.1% | 10.4% |
| Standard Deviation (Population) | 6.1% | 10.3% |
Similar Demographics by In Labor Force | Age 35-44
Demographics Similar to Immigrants from Belarus by In Labor Force | Age 35-44
In terms of in labor force | age 35-44, the demographic groups most similar to Immigrants from Belarus are Immigrants from Southern Europe (84.8%, a difference of 0.0%), Immigrants from Sweden (84.8%, a difference of 0.0%), Immigrants from Australia (84.8%, a difference of 0.010%), South American (84.8%, a difference of 0.010%), and Immigrants from Bahamas (84.8%, a difference of 0.010%).
| Demographics | Rating | Rank | In Labor Force | Age 35-44 |
| Cubans | 96.6 /100 | #96 | Exceptional 84.8% |
| Egyptians | 96.6 /100 | #97 | Exceptional 84.8% |
| Indians (Asian) | 96.1 /100 | #98 | Exceptional 84.8% |
| Haitians | 96.0 /100 | #99 | Exceptional 84.8% |
| Immigrants | Czechoslovakia | 95.9 /100 | #100 | Exceptional 84.8% |
| Immigrants | Australia | 95.5 /100 | #101 | Exceptional 84.8% |
| Immigrants | Southern Europe | 95.3 /100 | #102 | Exceptional 84.8% |
| Immigrants | Belarus | 95.3 /100 | #103 | Exceptional 84.8% |
| Immigrants | Sweden | 95.2 /100 | #104 | Exceptional 84.8% |
| South Americans | 95.0 /100 | #105 | Exceptional 84.8% |
| Immigrants | Bahamas | 94.8 /100 | #106 | Exceptional 84.8% |
| Immigrants | Romania | 94.7 /100 | #107 | Exceptional 84.8% |
| Immigrants | Argentina | 94.5 /100 | #108 | Exceptional 84.8% |
| Immigrants | Russia | 94.5 /100 | #109 | Exceptional 84.8% |
| Filipinos | 93.8 /100 | #110 | Exceptional 84.7% |
Demographics Similar to Immigrants from Western Europe by In Labor Force | Age 35-44
In terms of in labor force | age 35-44, the demographic groups most similar to Immigrants from Western Europe are Immigrants from England (84.2%, a difference of 0.0%), Immigrants from Indonesia (84.2%, a difference of 0.010%), Immigrants from Caribbean (84.2%, a difference of 0.010%), Ecuadorian (84.2%, a difference of 0.010%), and Syrian (84.2%, a difference of 0.010%).
| Demographics | Rating | Rank | In Labor Force | Age 35-44 |
| Portuguese | 31.9 /100 | #190 | Fair 84.3% |
| Immigrants | Philippines | 27.9 /100 | #191 | Fair 84.2% |
| Immigrants | Vietnam | 27.4 /100 | #192 | Fair 84.2% |
| Hungarians | 26.8 /100 | #193 | Fair 84.2% |
| Immigrants | Indonesia | 25.7 /100 | #194 | Fair 84.2% |
| Immigrants | Caribbean | 25.7 /100 | #195 | Fair 84.2% |
| Immigrants | England | 25.0 /100 | #196 | Fair 84.2% |
| Immigrants | Western Europe | 24.7 /100 | #197 | Fair 84.2% |
| Ecuadorians | 24.0 /100 | #198 | Fair 84.2% |
| Syrians | 23.2 /100 | #199 | Fair 84.2% |
| Moroccans | 23.2 /100 | #200 | Fair 84.2% |
| British | 23.0 /100 | #201 | Fair 84.2% |
| Immigrants | Uzbekistan | 22.8 /100 | #202 | Fair 84.2% |
| Immigrants | South Eastern Asia | 22.4 /100 | #203 | Fair 84.2% |
| Canadians | 19.9 /100 | #204 | Poor 84.2% |