Immigrants from Chile vs Scottish In Labor Force | Age 35-44
COMPARE
Immigrants from Chile
Scottish
In Labor Force | Age 35-44
In Labor Force | Age 35-44 Comparison
Immigrants from Chile
Scottish
84.6%
IN LABOR FORCE | AGE 35-44
84.6/ 100
METRIC RATING
137th/ 347
METRIC RANK
83.9%
IN LABOR FORCE | AGE 35-44
3.2/ 100
METRIC RATING
231st/ 347
METRIC RANK
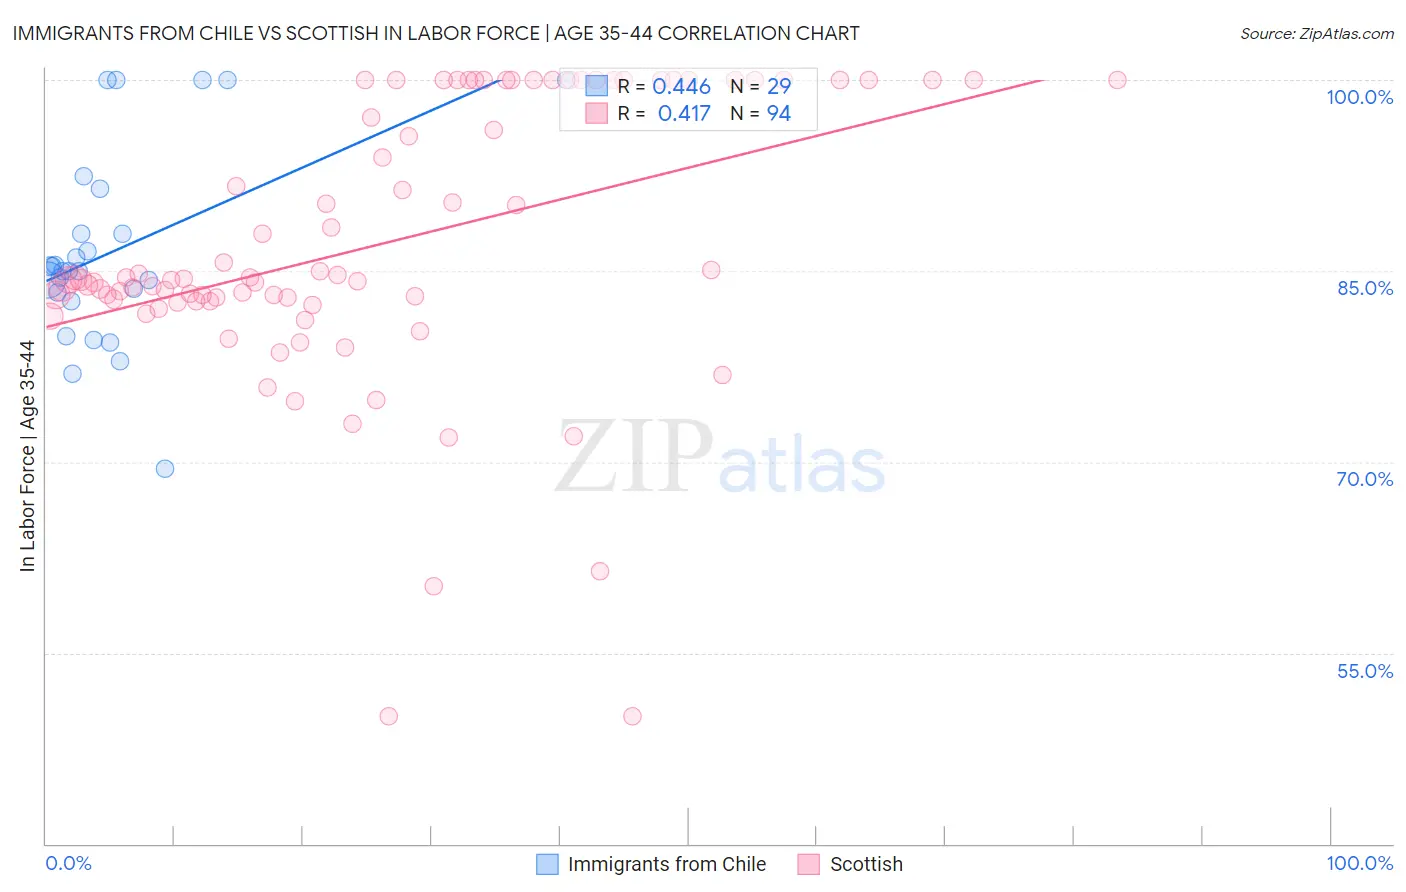
Immigrants from Chile vs Scottish In Labor Force | Age 35-44 Correlation Chart
The statistical analysis conducted on geographies consisting of 218,627,493 people shows a moderate positive correlation between the proportion of Immigrants from Chile and labor force participation rate among population between the ages 35 and 44 in the United States with a correlation coefficient (R) of 0.446 and weighted average of 84.6%. Similarly, the statistical analysis conducted on geographies consisting of 566,464,566 people shows a moderate positive correlation between the proportion of Scottish and labor force participation rate among population between the ages 35 and 44 in the United States with a correlation coefficient (R) of 0.417 and weighted average of 83.9%, a difference of 0.83%.
In Labor Force | Age 35-44 Correlation Summary
| Measurement | Immigrants from Chile | Scottish |
| Minimum | 69.5% | 50.0% |
| Maximum | 100.0% | 100.0% |
| Range | 30.5% | 50.0% |
| Mean | 86.5% | 87.1% |
| Median | 85.0% | 84.4% |
| Interquartile 25% (IQ1) | 83.0% | 82.6% |
| Interquartile 75% (IQ3) | 89.7% | 100.0% |
| Interquartile Range (IQR) | 6.7% | 17.4% |
| Standard Deviation (Sample) | 7.6% | 10.9% |
| Standard Deviation (Population) | 7.5% | 10.8% |
Similar Demographics by In Labor Force | Age 35-44
Demographics Similar to Immigrants from Chile by In Labor Force | Age 35-44
In terms of in labor force | age 35-44, the demographic groups most similar to Immigrants from Chile are Afghan (84.6%, a difference of 0.020%), Czechoslovakian (84.6%, a difference of 0.020%), Immigrants from Zaire (84.6%, a difference of 0.020%), Immigrants from Malaysia (84.6%, a difference of 0.040%), and Immigrants from Japan (84.6%, a difference of 0.040%).
| Demographics | Rating | Rank | In Labor Force | Age 35-44 |
| Bhutanese | 89.7 /100 | #130 | Excellent 84.7% |
| Immigrants | Scotland | 89.6 /100 | #131 | Excellent 84.7% |
| Austrians | 89.4 /100 | #132 | Excellent 84.7% |
| Argentineans | 88.4 /100 | #133 | Excellent 84.6% |
| Immigrants | Korea | 88.2 /100 | #134 | Excellent 84.6% |
| Immigrants | Malaysia | 87.5 /100 | #135 | Excellent 84.6% |
| Afghans | 86.3 /100 | #136 | Excellent 84.6% |
| Immigrants | Chile | 84.6 /100 | #137 | Excellent 84.6% |
| Czechoslovakians | 82.6 /100 | #138 | Excellent 84.6% |
| Immigrants | Zaire | 82.5 /100 | #139 | Excellent 84.6% |
| Immigrants | Japan | 81.4 /100 | #140 | Excellent 84.6% |
| Immigrants | Belgium | 80.8 /100 | #141 | Excellent 84.6% |
| Immigrants | Uruguay | 80.1 /100 | #142 | Excellent 84.6% |
| Immigrants | Ukraine | 79.7 /100 | #143 | Good 84.6% |
| Immigrants | Jamaica | 79.4 /100 | #144 | Good 84.6% |
Demographics Similar to Scottish by In Labor Force | Age 35-44
In terms of in labor force | age 35-44, the demographic groups most similar to Scottish are Native Hawaiian (83.9%, a difference of 0.010%), Immigrants from Germany (83.9%, a difference of 0.020%), Immigrants from Iraq (83.9%, a difference of 0.030%), Immigrants from Oceania (83.9%, a difference of 0.030%), and Immigrants from Syria (83.9%, a difference of 0.040%).
| Demographics | Rating | Rank | In Labor Force | Age 35-44 |
| U.S. Virgin Islanders | 6.1 /100 | #224 | Tragic 84.0% |
| Immigrants | Burma/Myanmar | 6.1 /100 | #225 | Tragic 84.0% |
| Panamanians | 5.4 /100 | #226 | Tragic 84.0% |
| British West Indians | 5.3 /100 | #227 | Tragic 84.0% |
| Welsh | 5.3 /100 | #228 | Tragic 84.0% |
| Immigrants | Thailand | 4.7 /100 | #229 | Tragic 84.0% |
| Immigrants | Iraq | 3.7 /100 | #230 | Tragic 83.9% |
| Scottish | 3.2 /100 | #231 | Tragic 83.9% |
| Native Hawaiians | 3.0 /100 | #232 | Tragic 83.9% |
| Immigrants | Germany | 2.8 /100 | #233 | Tragic 83.9% |
| Immigrants | Oceania | 2.6 /100 | #234 | Tragic 83.9% |
| Immigrants | Syria | 2.5 /100 | #235 | Tragic 83.9% |
| West Indians | 2.4 /100 | #236 | Tragic 83.9% |
| English | 1.8 /100 | #237 | Tragic 83.8% |
| Immigrants | Laos | 1.7 /100 | #238 | Tragic 83.8% |