Immigrants from Belarus vs Immigrants from Ethiopia In Labor Force | Age > 16
COMPARE
Immigrants from Belarus
Immigrants from Ethiopia
In Labor Force | Age > 16
In Labor Force | Age > 16 Comparison
Immigrants from Belarus
Immigrants from Ethiopia
65.2%
IN LABOR FORCE | AGE > 16
66.0/ 100
METRIC RATING
167th/ 347
METRIC RANK
69.4%
IN LABOR FORCE | AGE > 16
100.0/ 100
METRIC RATING
1st/ 347
METRIC RANK
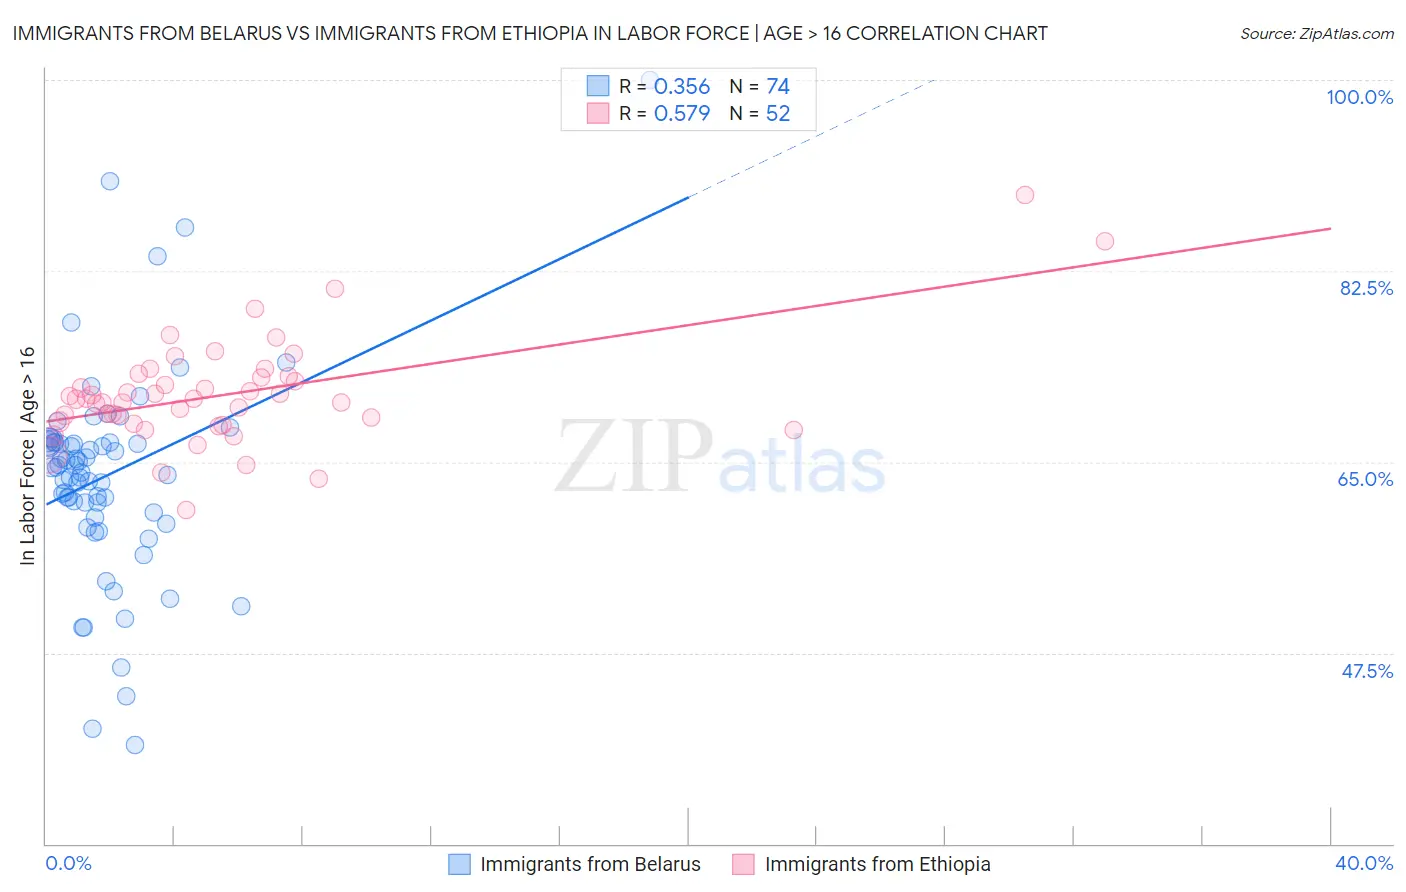
Immigrants from Belarus vs Immigrants from Ethiopia In Labor Force | Age > 16 Correlation Chart
The statistical analysis conducted on geographies consisting of 150,205,158 people shows a mild positive correlation between the proportion of Immigrants from Belarus and labor force participation rate among population ages 16 and over in the United States with a correlation coefficient (R) of 0.356 and weighted average of 65.2%. Similarly, the statistical analysis conducted on geographies consisting of 211,573,899 people shows a substantial positive correlation between the proportion of Immigrants from Ethiopia and labor force participation rate among population ages 16 and over in the United States with a correlation coefficient (R) of 0.579 and weighted average of 69.4%, a difference of 6.4%.
In Labor Force | Age > 16 Correlation Summary
| Measurement | Immigrants from Belarus | Immigrants from Ethiopia |
| Minimum | 39.1% | 60.6% |
| Maximum | 100.0% | 89.5% |
| Range | 60.9% | 28.9% |
| Mean | 63.8% | 71.2% |
| Median | 64.5% | 70.8% |
| Interquartile 25% (IQ1) | 60.4% | 68.6% |
| Interquartile 75% (IQ3) | 66.8% | 72.8% |
| Interquartile Range (IQR) | 6.4% | 4.2% |
| Standard Deviation (Sample) | 9.7% | 4.9% |
| Standard Deviation (Population) | 9.7% | 4.9% |
Similar Demographics by In Labor Force | Age > 16
Demographics Similar to Immigrants from Belarus by In Labor Force | Age > 16
In terms of in labor force | age > 16, the demographic groups most similar to Immigrants from Belarus are Immigrants from Western Asia (65.3%, a difference of 0.020%), Immigrants from Kazakhstan (65.3%, a difference of 0.030%), Serbian (65.2%, a difference of 0.030%), Danish (65.3%, a difference of 0.040%), and Arab (65.2%, a difference of 0.040%).
| Demographics | Rating | Rank | In Labor Force | Age > 16 |
| Immigrants | South Africa | 73.5 /100 | #160 | Good 65.3% |
| Australians | 71.3 /100 | #161 | Good 65.3% |
| Albanians | 70.8 /100 | #162 | Good 65.3% |
| South Africans | 69.8 /100 | #163 | Good 65.3% |
| Danes | 68.8 /100 | #164 | Good 65.3% |
| Immigrants | Kazakhstan | 68.1 /100 | #165 | Good 65.3% |
| Immigrants | Western Asia | 67.3 /100 | #166 | Good 65.3% |
| Immigrants | Belarus | 66.0 /100 | #167 | Good 65.2% |
| Serbians | 63.5 /100 | #168 | Good 65.2% |
| Arabs | 62.4 /100 | #169 | Good 65.2% |
| Immigrants | Israel | 61.7 /100 | #170 | Good 65.2% |
| Israelis | 61.6 /100 | #171 | Good 65.2% |
| Immigrants | Sweden | 61.3 /100 | #172 | Good 65.2% |
| Immigrants | Ukraine | 53.7 /100 | #173 | Average 65.1% |
| Macedonians | 50.0 /100 | #174 | Average 65.1% |
Demographics Similar to Immigrants from Ethiopia by In Labor Force | Age > 16
In terms of in labor force | age > 16, the demographic groups most similar to Immigrants from Ethiopia are Ethiopian (69.3%, a difference of 0.16%), Somali (69.2%, a difference of 0.36%), Immigrants from Somalia (69.1%, a difference of 0.44%), Sierra Leonean (68.9%, a difference of 0.75%), and Immigrants from Eritrea (68.9%, a difference of 0.80%).
| Demographics | Rating | Rank | In Labor Force | Age > 16 |
| Immigrants | Ethiopia | 100.0 /100 | #1 | Exceptional 69.4% |
| Ethiopians | 100.0 /100 | #2 | Exceptional 69.3% |
| Somalis | 100.0 /100 | #3 | Exceptional 69.2% |
| Immigrants | Somalia | 100.0 /100 | #4 | Exceptional 69.1% |
| Sierra Leoneans | 100.0 /100 | #5 | Exceptional 68.9% |
| Immigrants | Eritrea | 100.0 /100 | #6 | Exceptional 68.9% |
| Immigrants | Cameroon | 100.0 /100 | #7 | Exceptional 68.7% |
| Immigrants | Sierra Leone | 100.0 /100 | #8 | Exceptional 68.5% |
| Immigrants | Eastern Africa | 100.0 /100 | #9 | Exceptional 68.5% |
| Immigrants | Bolivia | 100.0 /100 | #10 | Exceptional 68.4% |
| Bolivians | 100.0 /100 | #11 | Exceptional 68.2% |
| Sudanese | 100.0 /100 | #12 | Exceptional 68.0% |
| Immigrants | Nepal | 100.0 /100 | #13 | Exceptional 68.0% |
| Liberians | 100.0 /100 | #14 | Exceptional 67.8% |
| Immigrants | Middle Africa | 100.0 /100 | #15 | Exceptional 67.7% |