Immigrants from Sri Lanka vs Immigrants from Ethiopia In Labor Force | Age > 16
COMPARE
Immigrants from Sri Lanka
Immigrants from Ethiopia
In Labor Force | Age > 16
In Labor Force | Age > 16 Comparison
Immigrants from Sri Lanka
Immigrants from Ethiopia
66.5%
IN LABOR FORCE | AGE > 16
99.9/ 100
METRIC RATING
53rd/ 347
METRIC RANK
69.4%
IN LABOR FORCE | AGE > 16
100.0/ 100
METRIC RATING
1st/ 347
METRIC RANK
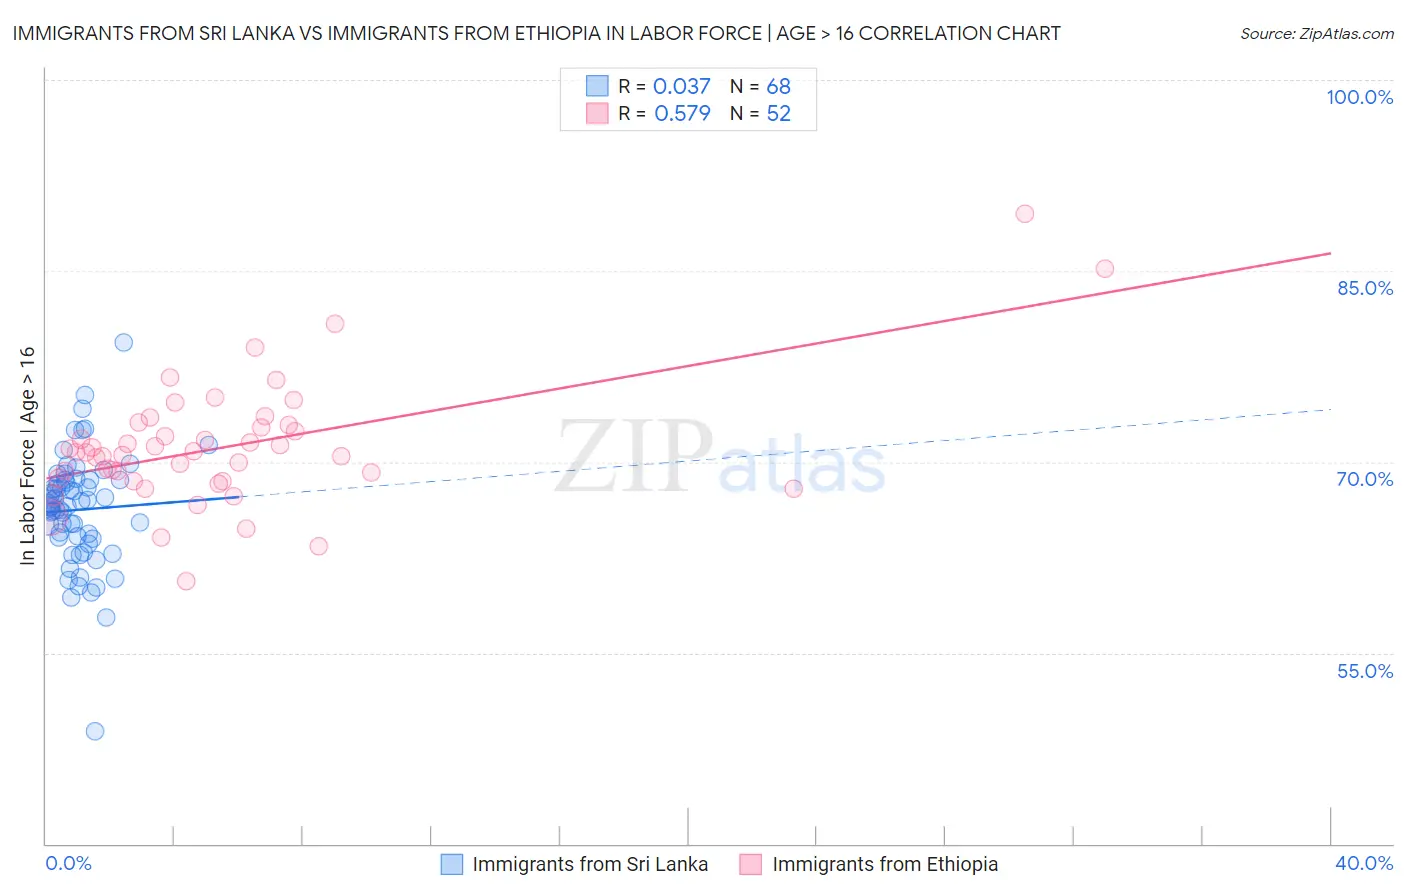
Immigrants from Sri Lanka vs Immigrants from Ethiopia In Labor Force | Age > 16 Correlation Chart
The statistical analysis conducted on geographies consisting of 149,698,830 people shows no correlation between the proportion of Immigrants from Sri Lanka and labor force participation rate among population ages 16 and over in the United States with a correlation coefficient (R) of 0.037 and weighted average of 66.5%. Similarly, the statistical analysis conducted on geographies consisting of 211,573,899 people shows a substantial positive correlation between the proportion of Immigrants from Ethiopia and labor force participation rate among population ages 16 and over in the United States with a correlation coefficient (R) of 0.579 and weighted average of 69.4%, a difference of 4.4%.
In Labor Force | Age > 16 Correlation Summary
| Measurement | Immigrants from Sri Lanka | Immigrants from Ethiopia |
| Minimum | 48.8% | 60.6% |
| Maximum | 79.4% | 89.5% |
| Range | 30.6% | 28.9% |
| Mean | 66.2% | 71.2% |
| Median | 66.5% | 70.8% |
| Interquartile 25% (IQ1) | 64.0% | 68.6% |
| Interquartile 75% (IQ3) | 68.6% | 72.8% |
| Interquartile Range (IQR) | 4.6% | 4.2% |
| Standard Deviation (Sample) | 4.5% | 4.9% |
| Standard Deviation (Population) | 4.4% | 4.9% |
Similar Demographics by In Labor Force | Age > 16
Demographics Similar to Immigrants from Sri Lanka by In Labor Force | Age > 16
In terms of in labor force | age > 16, the demographic groups most similar to Immigrants from Sri Lanka are Paraguayan (66.5%, a difference of 0.020%), Immigrants from Bosnia and Herzegovina (66.5%, a difference of 0.030%), Immigrants from Kuwait (66.5%, a difference of 0.050%), Immigrants from Venezuela (66.4%, a difference of 0.080%), and Immigrants from Senegal (66.4%, a difference of 0.11%).
| Demographics | Rating | Rank | In Labor Force | Age > 16 |
| Brazilians | 100.0 /100 | #46 | Exceptional 66.6% |
| Immigrants | Bulgaria | 100.0 /100 | #47 | Exceptional 66.6% |
| Nigerians | 100.0 /100 | #48 | Exceptional 66.6% |
| Immigrants | Northern Africa | 100.0 /100 | #49 | Exceptional 66.6% |
| Cape Verdeans | 100.0 /100 | #50 | Exceptional 66.6% |
| Immigrants | Kuwait | 100.0 /100 | #51 | Exceptional 66.5% |
| Paraguayans | 99.9 /100 | #52 | Exceptional 66.5% |
| Immigrants | Sri Lanka | 99.9 /100 | #53 | Exceptional 66.5% |
| Immigrants | Bosnia and Herzegovina | 99.9 /100 | #54 | Exceptional 66.5% |
| Immigrants | Venezuela | 99.9 /100 | #55 | Exceptional 66.4% |
| Immigrants | Senegal | 99.9 /100 | #56 | Exceptional 66.4% |
| Bulgarians | 99.9 /100 | #57 | Exceptional 66.4% |
| Immigrants | Saudi Arabia | 99.9 /100 | #58 | Exceptional 66.3% |
| Immigrants | Turkey | 99.9 /100 | #59 | Exceptional 66.3% |
| Immigrants | Peru | 99.8 /100 | #60 | Exceptional 66.3% |
Demographics Similar to Immigrants from Ethiopia by In Labor Force | Age > 16
In terms of in labor force | age > 16, the demographic groups most similar to Immigrants from Ethiopia are Ethiopian (69.3%, a difference of 0.16%), Somali (69.2%, a difference of 0.36%), Immigrants from Somalia (69.1%, a difference of 0.44%), Sierra Leonean (68.9%, a difference of 0.75%), and Immigrants from Eritrea (68.9%, a difference of 0.80%).
| Demographics | Rating | Rank | In Labor Force | Age > 16 |
| Immigrants | Ethiopia | 100.0 /100 | #1 | Exceptional 69.4% |
| Ethiopians | 100.0 /100 | #2 | Exceptional 69.3% |
| Somalis | 100.0 /100 | #3 | Exceptional 69.2% |
| Immigrants | Somalia | 100.0 /100 | #4 | Exceptional 69.1% |
| Sierra Leoneans | 100.0 /100 | #5 | Exceptional 68.9% |
| Immigrants | Eritrea | 100.0 /100 | #6 | Exceptional 68.9% |
| Immigrants | Cameroon | 100.0 /100 | #7 | Exceptional 68.7% |
| Immigrants | Sierra Leone | 100.0 /100 | #8 | Exceptional 68.5% |
| Immigrants | Eastern Africa | 100.0 /100 | #9 | Exceptional 68.5% |
| Immigrants | Bolivia | 100.0 /100 | #10 | Exceptional 68.4% |
| Bolivians | 100.0 /100 | #11 | Exceptional 68.2% |
| Sudanese | 100.0 /100 | #12 | Exceptional 68.0% |
| Immigrants | Nepal | 100.0 /100 | #13 | Exceptional 68.0% |
| Liberians | 100.0 /100 | #14 | Exceptional 67.8% |
| Immigrants | Middle Africa | 100.0 /100 | #15 | Exceptional 67.7% |