Immigrants from Belarus vs Afghan In Labor Force | Age > 16
COMPARE
Immigrants from Belarus
Afghan
In Labor Force | Age > 16
In Labor Force | Age > 16 Comparison
Immigrants from Belarus
Afghans
65.2%
IN LABOR FORCE | AGE > 16
66.0/ 100
METRIC RATING
167th/ 347
METRIC RANK
67.1%
IN LABOR FORCE | AGE > 16
100.0/ 100
METRIC RATING
33rd/ 347
METRIC RANK
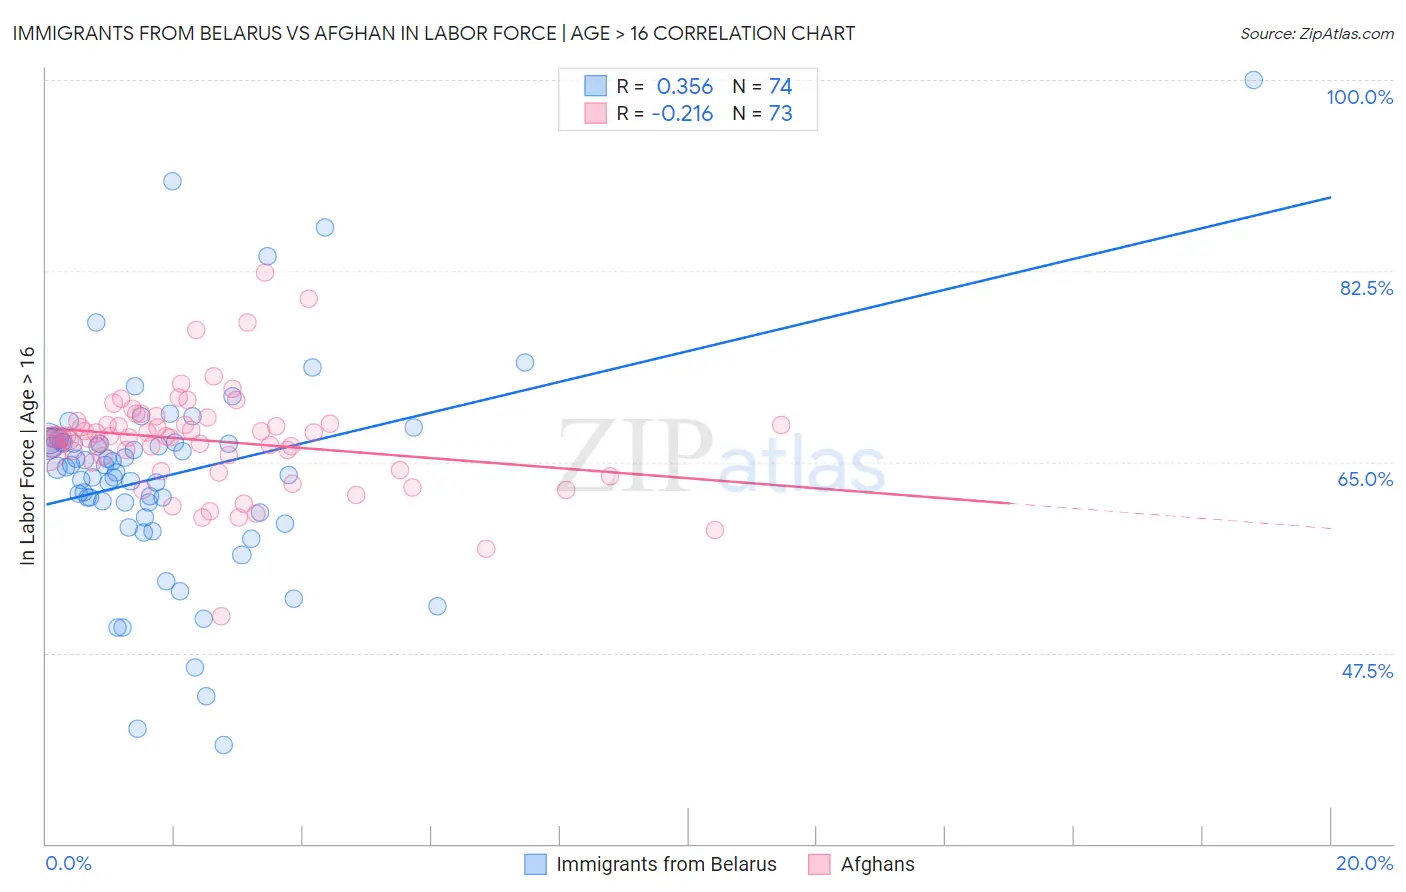
Immigrants from Belarus vs Afghan In Labor Force | Age > 16 Correlation Chart
The statistical analysis conducted on geographies consisting of 150,205,158 people shows a mild positive correlation between the proportion of Immigrants from Belarus and labor force participation rate among population ages 16 and over in the United States with a correlation coefficient (R) of 0.356 and weighted average of 65.2%. Similarly, the statistical analysis conducted on geographies consisting of 148,872,277 people shows a weak negative correlation between the proportion of Afghans and labor force participation rate among population ages 16 and over in the United States with a correlation coefficient (R) of -0.216 and weighted average of 67.1%, a difference of 2.9%.
In Labor Force | Age > 16 Correlation Summary
| Measurement | Immigrants from Belarus | Afghan |
| Minimum | 39.1% | 50.8% |
| Maximum | 100.0% | 82.3% |
| Range | 60.9% | 31.5% |
| Mean | 63.8% | 66.9% |
| Median | 64.5% | 67.2% |
| Interquartile 25% (IQ1) | 60.4% | 64.6% |
| Interquartile 75% (IQ3) | 66.8% | 68.6% |
| Interquartile Range (IQR) | 6.4% | 4.0% |
| Standard Deviation (Sample) | 9.7% | 4.8% |
| Standard Deviation (Population) | 9.7% | 4.8% |
Similar Demographics by In Labor Force | Age > 16
Demographics Similar to Immigrants from Belarus by In Labor Force | Age > 16
In terms of in labor force | age > 16, the demographic groups most similar to Immigrants from Belarus are Immigrants from Western Asia (65.3%, a difference of 0.020%), Immigrants from Kazakhstan (65.3%, a difference of 0.030%), Serbian (65.2%, a difference of 0.030%), Danish (65.3%, a difference of 0.040%), and Arab (65.2%, a difference of 0.040%).
| Demographics | Rating | Rank | In Labor Force | Age > 16 |
| Immigrants | South Africa | 73.5 /100 | #160 | Good 65.3% |
| Australians | 71.3 /100 | #161 | Good 65.3% |
| Albanians | 70.8 /100 | #162 | Good 65.3% |
| South Africans | 69.8 /100 | #163 | Good 65.3% |
| Danes | 68.8 /100 | #164 | Good 65.3% |
| Immigrants | Kazakhstan | 68.1 /100 | #165 | Good 65.3% |
| Immigrants | Western Asia | 67.3 /100 | #166 | Good 65.3% |
| Immigrants | Belarus | 66.0 /100 | #167 | Good 65.2% |
| Serbians | 63.5 /100 | #168 | Good 65.2% |
| Arabs | 62.4 /100 | #169 | Good 65.2% |
| Immigrants | Israel | 61.7 /100 | #170 | Good 65.2% |
| Israelis | 61.6 /100 | #171 | Good 65.2% |
| Immigrants | Sweden | 61.3 /100 | #172 | Good 65.2% |
| Immigrants | Ukraine | 53.7 /100 | #173 | Average 65.1% |
| Macedonians | 50.0 /100 | #174 | Average 65.1% |
Demographics Similar to Afghans by In Labor Force | Age > 16
In terms of in labor force | age > 16, the demographic groups most similar to Afghans are Immigrants from Congo (67.1%, a difference of 0.0%), Immigrants from Ghana (67.1%, a difference of 0.010%), Ghanaian (67.1%, a difference of 0.060%), Immigrants from South Central Asia (67.1%, a difference of 0.070%), and Immigrants from Western Africa (67.1%, a difference of 0.070%).
| Demographics | Rating | Rank | In Labor Force | Age > 16 |
| Immigrants | Cabo Verde | 100.0 /100 | #26 | Exceptional 67.3% |
| Zimbabweans | 100.0 /100 | #27 | Exceptional 67.3% |
| Immigrants | Morocco | 100.0 /100 | #28 | Exceptional 67.2% |
| Thais | 100.0 /100 | #29 | Exceptional 67.2% |
| Immigrants | Zaire | 100.0 /100 | #30 | Exceptional 67.2% |
| Ghanaians | 100.0 /100 | #31 | Exceptional 67.1% |
| Immigrants | Congo | 100.0 /100 | #32 | Exceptional 67.1% |
| Afghans | 100.0 /100 | #33 | Exceptional 67.1% |
| Immigrants | Ghana | 100.0 /100 | #34 | Exceptional 67.1% |
| Immigrants | South Central Asia | 100.0 /100 | #35 | Exceptional 67.1% |
| Immigrants | Western Africa | 100.0 /100 | #36 | Exceptional 67.1% |
| Immigrants | Afghanistan | 100.0 /100 | #37 | Exceptional 67.0% |
| Immigrants | Nigeria | 100.0 /100 | #38 | Exceptional 66.9% |
| Salvadorans | 100.0 /100 | #39 | Exceptional 66.8% |
| Immigrants | El Salvador | 100.0 /100 | #40 | Exceptional 66.8% |