Alsatian vs Immigrants from Ethiopia In Labor Force | Age > 16
COMPARE
Alsatian
Immigrants from Ethiopia
In Labor Force | Age > 16
In Labor Force | Age > 16 Comparison
Alsatians
Immigrants from Ethiopia
64.7%
IN LABOR FORCE | AGE > 16
10.7/ 100
METRIC RATING
218th/ 347
METRIC RANK
69.4%
IN LABOR FORCE | AGE > 16
100.0/ 100
METRIC RATING
1st/ 347
METRIC RANK
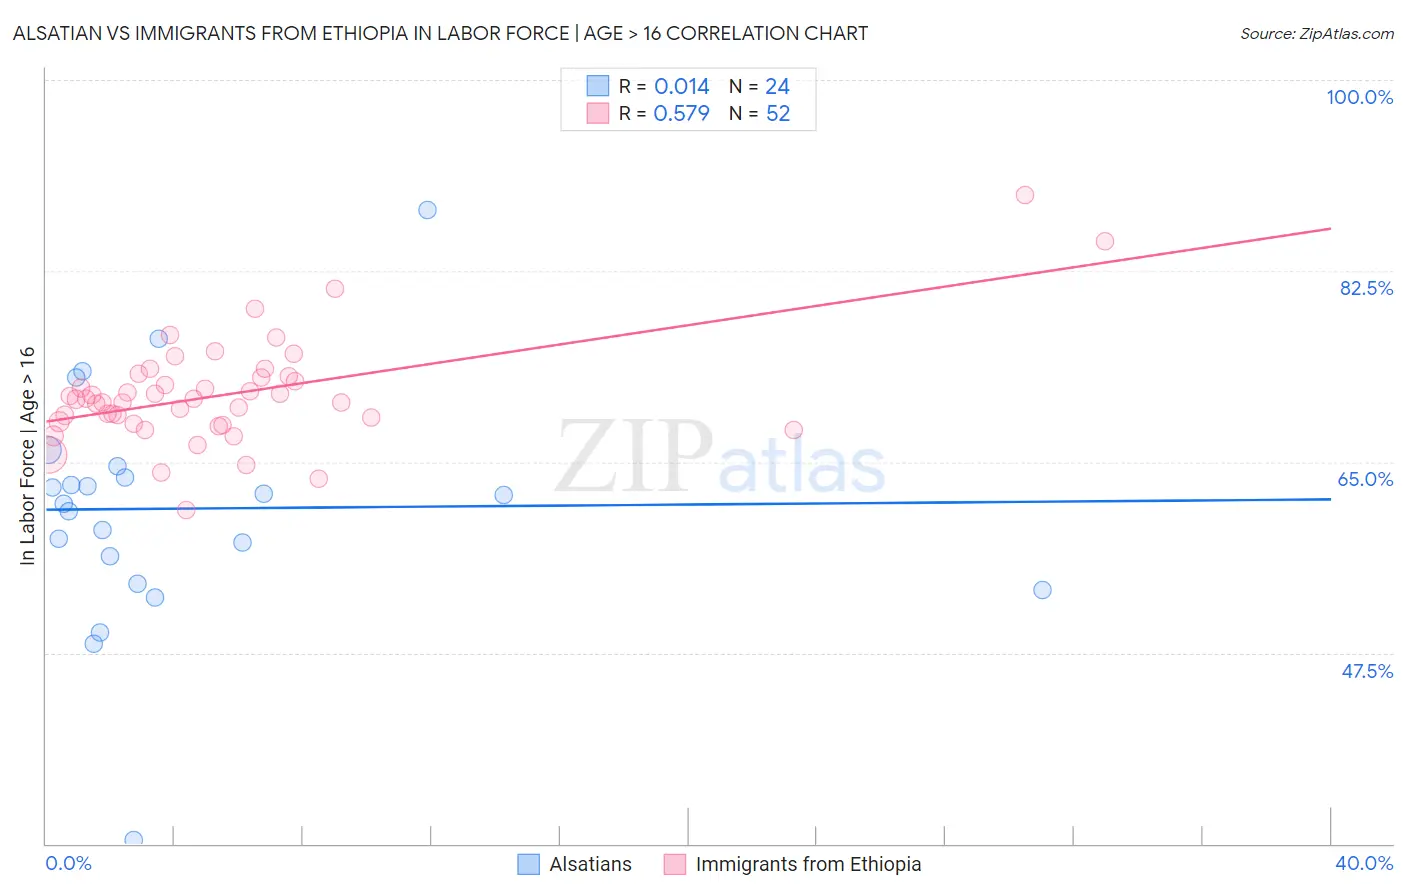
Alsatian vs Immigrants from Ethiopia In Labor Force | Age > 16 Correlation Chart
The statistical analysis conducted on geographies consisting of 82,681,658 people shows no correlation between the proportion of Alsatians and labor force participation rate among population ages 16 and over in the United States with a correlation coefficient (R) of 0.014 and weighted average of 64.7%. Similarly, the statistical analysis conducted on geographies consisting of 211,573,899 people shows a substantial positive correlation between the proportion of Immigrants from Ethiopia and labor force participation rate among population ages 16 and over in the United States with a correlation coefficient (R) of 0.579 and weighted average of 69.4%, a difference of 7.2%.
In Labor Force | Age > 16 Correlation Summary
| Measurement | Alsatian | Immigrants from Ethiopia |
| Minimum | 30.3% | 60.6% |
| Maximum | 88.1% | 89.5% |
| Range | 57.8% | 28.9% |
| Mean | 60.7% | 71.2% |
| Median | 61.6% | 70.8% |
| Interquartile 25% (IQ1) | 55.1% | 68.6% |
| Interquartile 75% (IQ3) | 64.1% | 72.8% |
| Interquartile Range (IQR) | 9.0% | 4.2% |
| Standard Deviation (Sample) | 11.0% | 4.9% |
| Standard Deviation (Population) | 10.8% | 4.9% |
Similar Demographics by In Labor Force | Age > 16
Demographics Similar to Alsatians by In Labor Force | Age > 16
In terms of in labor force | age > 16, the demographic groups most similar to Alsatians are Immigrants from Central America (64.7%, a difference of 0.010%), Belgian (64.7%, a difference of 0.020%), U.S. Virgin Islander (64.7%, a difference of 0.020%), Alaska Native (64.7%, a difference of 0.030%), and Immigrants from Micronesia (64.7%, a difference of 0.030%).
| Demographics | Rating | Rank | In Labor Force | Age > 16 |
| Fijians | 14.1 /100 | #211 | Poor 64.8% |
| Alaskan Athabascans | 13.9 /100 | #212 | Poor 64.8% |
| Maltese | 13.8 /100 | #213 | Poor 64.8% |
| Estonians | 13.1 /100 | #214 | Poor 64.8% |
| Immigrants | Czechoslovakia | 12.3 /100 | #215 | Poor 64.8% |
| Belgians | 11.4 /100 | #216 | Poor 64.7% |
| U.S. Virgin Islanders | 11.3 /100 | #217 | Poor 64.7% |
| Alsatians | 10.7 /100 | #218 | Poor 64.7% |
| Immigrants | Central America | 10.5 /100 | #219 | Poor 64.7% |
| Alaska Natives | 9.9 /100 | #220 | Tragic 64.7% |
| Immigrants | Micronesia | 9.6 /100 | #221 | Tragic 64.7% |
| Hawaiians | 9.3 /100 | #222 | Tragic 64.7% |
| Immigrants | Belize | 9.2 /100 | #223 | Tragic 64.7% |
| Immigrants | Jamaica | 8.8 /100 | #224 | Tragic 64.7% |
| Croatians | 8.8 /100 | #225 | Tragic 64.7% |
Demographics Similar to Immigrants from Ethiopia by In Labor Force | Age > 16
In terms of in labor force | age > 16, the demographic groups most similar to Immigrants from Ethiopia are Ethiopian (69.3%, a difference of 0.16%), Somali (69.2%, a difference of 0.36%), Immigrants from Somalia (69.1%, a difference of 0.44%), Sierra Leonean (68.9%, a difference of 0.75%), and Immigrants from Eritrea (68.9%, a difference of 0.80%).
| Demographics | Rating | Rank | In Labor Force | Age > 16 |
| Immigrants | Ethiopia | 100.0 /100 | #1 | Exceptional 69.4% |
| Ethiopians | 100.0 /100 | #2 | Exceptional 69.3% |
| Somalis | 100.0 /100 | #3 | Exceptional 69.2% |
| Immigrants | Somalia | 100.0 /100 | #4 | Exceptional 69.1% |
| Sierra Leoneans | 100.0 /100 | #5 | Exceptional 68.9% |
| Immigrants | Eritrea | 100.0 /100 | #6 | Exceptional 68.9% |
| Immigrants | Cameroon | 100.0 /100 | #7 | Exceptional 68.7% |
| Immigrants | Sierra Leone | 100.0 /100 | #8 | Exceptional 68.5% |
| Immigrants | Eastern Africa | 100.0 /100 | #9 | Exceptional 68.5% |
| Immigrants | Bolivia | 100.0 /100 | #10 | Exceptional 68.4% |
| Bolivians | 100.0 /100 | #11 | Exceptional 68.2% |
| Sudanese | 100.0 /100 | #12 | Exceptional 68.0% |
| Immigrants | Nepal | 100.0 /100 | #13 | Exceptional 68.0% |
| Liberians | 100.0 /100 | #14 | Exceptional 67.8% |
| Immigrants | Middle Africa | 100.0 /100 | #15 | Exceptional 67.7% |