Immigrants from Belarus vs Immigrants from Ethiopia Unemployment Among Ages 16 to 19 years
COMPARE
Immigrants from Belarus
Immigrants from Ethiopia
Unemployment Among Ages 16 to 19 years
Unemployment Among Ages 16 to 19 years Comparison
Immigrants from Belarus
Immigrants from Ethiopia
18.6%
UNEMPLOYMENT AMONG AGES 16 TO 19 YEARS
0.8/ 100
METRIC RATING
245th/ 347
METRIC RANK
17.8%
UNEMPLOYMENT AMONG AGES 16 TO 19 YEARS
27.4/ 100
METRIC RATING
201st/ 347
METRIC RANK
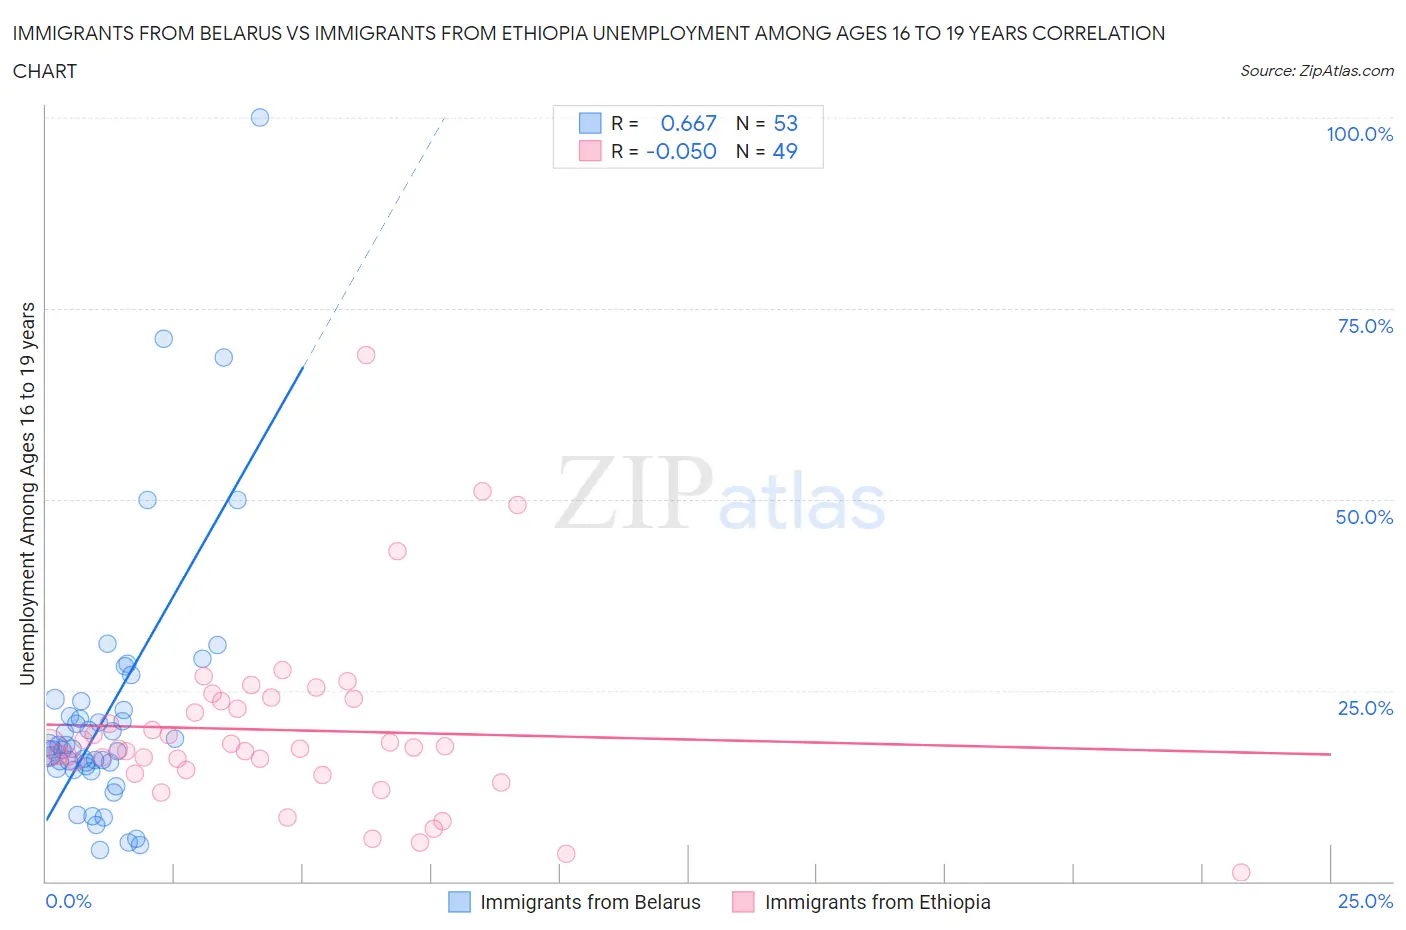
Immigrants from Belarus vs Immigrants from Ethiopia Unemployment Among Ages 16 to 19 years Correlation Chart
The statistical analysis conducted on geographies consisting of 145,960,072 people shows a significant positive correlation between the proportion of Immigrants from Belarus and unemployment rate among population between the ages 16 and 19 in the United States with a correlation coefficient (R) of 0.667 and weighted average of 18.6%. Similarly, the statistical analysis conducted on geographies consisting of 206,320,578 people shows no correlation between the proportion of Immigrants from Ethiopia and unemployment rate among population between the ages 16 and 19 in the United States with a correlation coefficient (R) of -0.050 and weighted average of 17.8%, a difference of 4.5%.
Unemployment Among Ages 16 to 19 years Correlation Summary
| Measurement | Immigrants from Belarus | Immigrants from Ethiopia |
| Minimum | 4.1% | 1.2% |
| Maximum | 100.0% | 68.9% |
| Range | 95.9% | 67.7% |
| Mean | 22.0% | 19.8% |
| Median | 17.4% | 17.5% |
| Interquartile 25% (IQ1) | 14.9% | 14.3% |
| Interquartile 75% (IQ3) | 23.1% | 23.7% |
| Interquartile Range (IQR) | 8.1% | 9.4% |
| Standard Deviation (Sample) | 17.2% | 12.1% |
| Standard Deviation (Population) | 17.0% | 11.9% |
Similar Demographics by Unemployment Among Ages 16 to 19 years
Demographics Similar to Immigrants from Belarus by Unemployment Among Ages 16 to 19 years
In terms of unemployment among ages 16 to 19 years, the demographic groups most similar to Immigrants from Belarus are Guatemalan (18.6%, a difference of 0.010%), Mexican (18.5%, a difference of 0.22%), Moroccan (18.5%, a difference of 0.38%), Immigrants from South America (18.7%, a difference of 0.42%), and Immigrants from Israel (18.7%, a difference of 0.47%).
| Demographics | Rating | Rank | Unemployment Among Ages 16 to 19 years |
| South Americans | 2.6 /100 | #238 | Tragic 18.3% |
| Native Hawaiians | 2.4 /100 | #239 | Tragic 18.3% |
| Immigrants | Cabo Verde | 2.0 /100 | #240 | Tragic 18.4% |
| Immigrants | Ukraine | 1.3 /100 | #241 | Tragic 18.5% |
| Moroccans | 1.1 /100 | #242 | Tragic 18.5% |
| Mexicans | 0.9 /100 | #243 | Tragic 18.5% |
| Guatemalans | 0.8 /100 | #244 | Tragic 18.6% |
| Immigrants | Belarus | 0.8 /100 | #245 | Tragic 18.6% |
| Immigrants | South America | 0.5 /100 | #246 | Tragic 18.7% |
| Immigrants | Israel | 0.5 /100 | #247 | Tragic 18.7% |
| Delaware | 0.5 /100 | #248 | Tragic 18.7% |
| Puget Sound Salish | 0.5 /100 | #249 | Tragic 18.7% |
| Panamanians | 0.4 /100 | #250 | Tragic 18.7% |
| Sub-Saharan Africans | 0.4 /100 | #251 | Tragic 18.7% |
| Immigrants | Guatemala | 0.4 /100 | #252 | Tragic 18.7% |
Demographics Similar to Immigrants from Ethiopia by Unemployment Among Ages 16 to 19 years
In terms of unemployment among ages 16 to 19 years, the demographic groups most similar to Immigrants from Ethiopia are Immigrants from Portugal (17.8%, a difference of 0.010%), Immigrants from Fiji (17.8%, a difference of 0.020%), Immigrants from Ireland (17.8%, a difference of 0.070%), Ethiopian (17.8%, a difference of 0.13%), and Immigrants from Czechoslovakia (17.8%, a difference of 0.14%).
| Demographics | Rating | Rank | Unemployment Among Ages 16 to 19 years |
| Peruvians | 38.8 /100 | #194 | Fair 17.7% |
| Immigrants | Peru | 37.3 /100 | #195 | Fair 17.7% |
| Alaskan Athabascans | 34.1 /100 | #196 | Fair 17.7% |
| Immigrants | Czechoslovakia | 29.8 /100 | #197 | Fair 17.8% |
| Ethiopians | 29.6 /100 | #198 | Fair 17.8% |
| Immigrants | Ireland | 28.5 /100 | #199 | Fair 17.8% |
| Immigrants | Fiji | 27.7 /100 | #200 | Fair 17.8% |
| Immigrants | Ethiopia | 27.4 /100 | #201 | Fair 17.8% |
| Immigrants | Portugal | 27.2 /100 | #202 | Fair 17.8% |
| Immigrants | Eastern Europe | 23.6 /100 | #203 | Fair 17.8% |
| Immigrants | Nonimmigrants | 20.9 /100 | #204 | Fair 17.9% |
| Assyrians/Chaldeans/Syriacs | 20.8 /100 | #205 | Fair 17.9% |
| Immigrants | Southern Europe | 18.9 /100 | #206 | Poor 17.9% |
| Liberians | 18.6 /100 | #207 | Poor 17.9% |
| Hawaiians | 16.8 /100 | #208 | Poor 17.9% |