Immigrants from Belarus vs Immigrants from Indonesia In Labor Force | Age > 16
COMPARE
Immigrants from Belarus
Immigrants from Indonesia
In Labor Force | Age > 16
In Labor Force | Age > 16 Comparison
Immigrants from Belarus
Immigrants from Indonesia
65.2%
IN LABOR FORCE | AGE > 16
66.0/ 100
METRIC RATING
167th/ 347
METRIC RANK
65.7%
IN LABOR FORCE | AGE > 16
96.8/ 100
METRIC RATING
115th/ 347
METRIC RANK
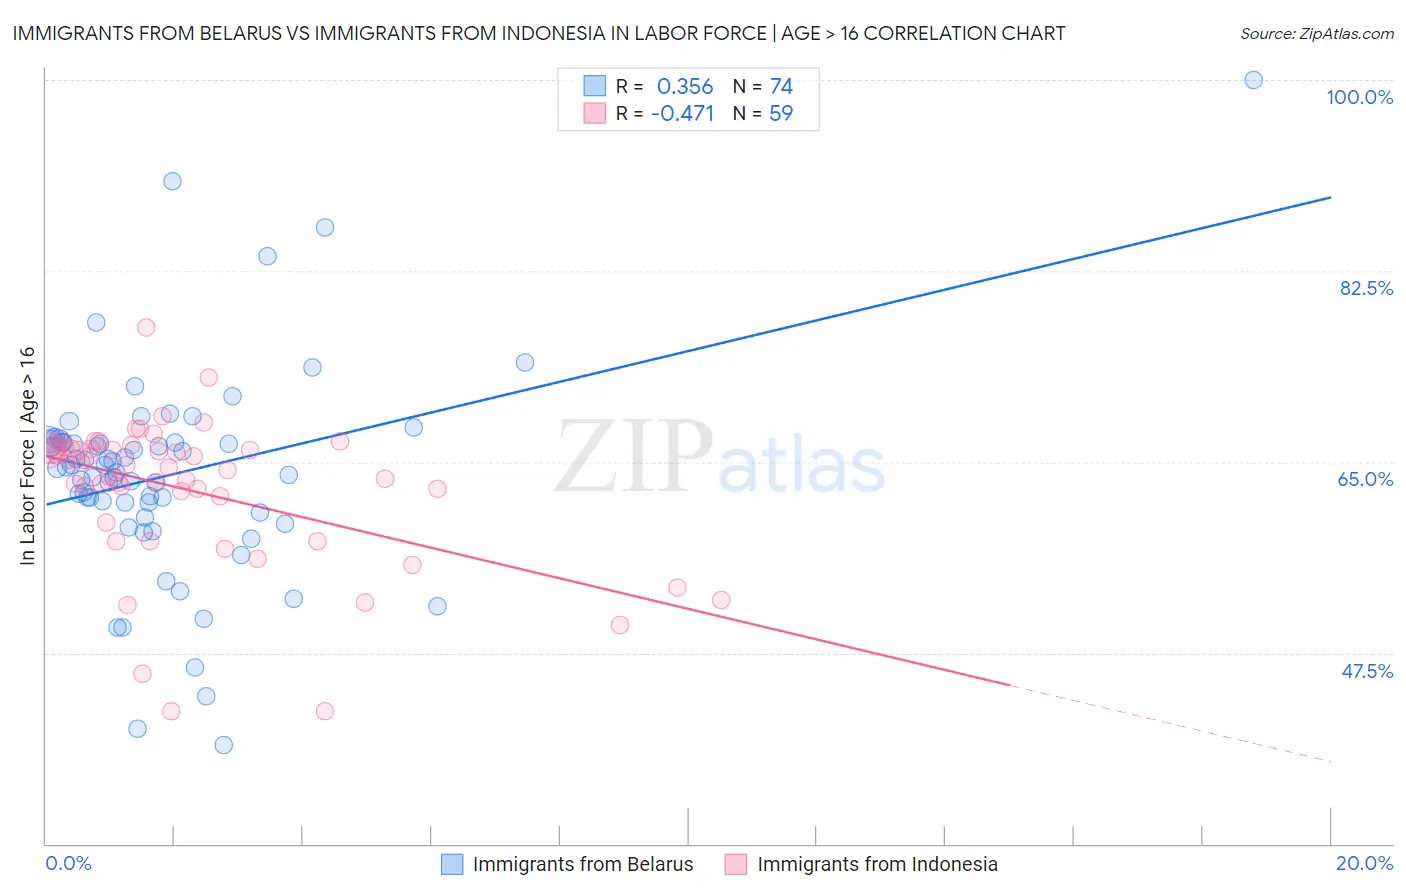
Immigrants from Belarus vs Immigrants from Indonesia In Labor Force | Age > 16 Correlation Chart
The statistical analysis conducted on geographies consisting of 150,205,158 people shows a mild positive correlation between the proportion of Immigrants from Belarus and labor force participation rate among population ages 16 and over in the United States with a correlation coefficient (R) of 0.356 and weighted average of 65.2%. Similarly, the statistical analysis conducted on geographies consisting of 215,789,599 people shows a moderate negative correlation between the proportion of Immigrants from Indonesia and labor force participation rate among population ages 16 and over in the United States with a correlation coefficient (R) of -0.471 and weighted average of 65.7%, a difference of 0.76%.
In Labor Force | Age > 16 Correlation Summary
| Measurement | Immigrants from Belarus | Immigrants from Indonesia |
| Minimum | 39.1% | 42.1% |
| Maximum | 100.0% | 77.3% |
| Range | 60.9% | 35.2% |
| Mean | 63.8% | 62.4% |
| Median | 64.5% | 64.5% |
| Interquartile 25% (IQ1) | 60.4% | 59.4% |
| Interquartile 75% (IQ3) | 66.8% | 66.2% |
| Interquartile Range (IQR) | 6.4% | 6.8% |
| Standard Deviation (Sample) | 9.7% | 6.8% |
| Standard Deviation (Population) | 9.7% | 6.7% |
Similar Demographics by In Labor Force | Age > 16
Demographics Similar to Immigrants from Belarus by In Labor Force | Age > 16
In terms of in labor force | age > 16, the demographic groups most similar to Immigrants from Belarus are Immigrants from Western Asia (65.3%, a difference of 0.020%), Immigrants from Kazakhstan (65.3%, a difference of 0.030%), Serbian (65.2%, a difference of 0.030%), Danish (65.3%, a difference of 0.040%), and Arab (65.2%, a difference of 0.040%).
| Demographics | Rating | Rank | In Labor Force | Age > 16 |
| Immigrants | South Africa | 73.5 /100 | #160 | Good 65.3% |
| Australians | 71.3 /100 | #161 | Good 65.3% |
| Albanians | 70.8 /100 | #162 | Good 65.3% |
| South Africans | 69.8 /100 | #163 | Good 65.3% |
| Danes | 68.8 /100 | #164 | Good 65.3% |
| Immigrants | Kazakhstan | 68.1 /100 | #165 | Good 65.3% |
| Immigrants | Western Asia | 67.3 /100 | #166 | Good 65.3% |
| Immigrants | Belarus | 66.0 /100 | #167 | Good 65.2% |
| Serbians | 63.5 /100 | #168 | Good 65.2% |
| Arabs | 62.4 /100 | #169 | Good 65.2% |
| Immigrants | Israel | 61.7 /100 | #170 | Good 65.2% |
| Israelis | 61.6 /100 | #171 | Good 65.2% |
| Immigrants | Sweden | 61.3 /100 | #172 | Good 65.2% |
| Immigrants | Ukraine | 53.7 /100 | #173 | Average 65.1% |
| Macedonians | 50.0 /100 | #174 | Average 65.1% |
Demographics Similar to Immigrants from Indonesia by In Labor Force | Age > 16
In terms of in labor force | age > 16, the demographic groups most similar to Immigrants from Indonesia are Argentinean (65.7%, a difference of 0.010%), Immigrants from Iran (65.7%, a difference of 0.010%), Immigrants from Thailand (65.7%, a difference of 0.020%), Pakistani (65.8%, a difference of 0.030%), and Honduran (65.8%, a difference of 0.030%).
| Demographics | Rating | Rank | In Labor Force | Age > 16 |
| Immigrants | Spain | 98.0 /100 | #108 | Exceptional 65.8% |
| Immigrants | Japan | 98.0 /100 | #109 | Exceptional 65.8% |
| Japanese | 97.7 /100 | #110 | Exceptional 65.8% |
| Immigrants | Honduras | 97.5 /100 | #111 | Exceptional 65.8% |
| Laotians | 97.4 /100 | #112 | Exceptional 65.8% |
| Pakistanis | 97.1 /100 | #113 | Exceptional 65.8% |
| Hondurans | 97.1 /100 | #114 | Exceptional 65.8% |
| Immigrants | Indonesia | 96.8 /100 | #115 | Exceptional 65.7% |
| Argentineans | 96.7 /100 | #116 | Exceptional 65.7% |
| Immigrants | Iran | 96.6 /100 | #117 | Exceptional 65.7% |
| Immigrants | Thailand | 96.6 /100 | #118 | Exceptional 65.7% |
| Immigrants | France | 96.4 /100 | #119 | Exceptional 65.7% |
| Immigrants | Hong Kong | 96.2 /100 | #120 | Exceptional 65.7% |
| New Zealanders | 96.0 /100 | #121 | Exceptional 65.7% |
| Immigrants | Ecuador | 95.9 /100 | #122 | Exceptional 65.7% |